. 2010 Jan 29;5(1):e8977.
doi: 10.1371/journal.pone.0008977.

Agroinfiltration reduces ABA levels and suppresses Pseudomonas syringae-elicited salicylic acid production in Nicotiana tabacum

Affiliations

Agroinfiltration reduces ABA levels and suppresses Pseudomonas syringae-elicited salicylic acid production in Nicotiana tabacum

Arantza Rico et al. PLoS One. .

Abstract

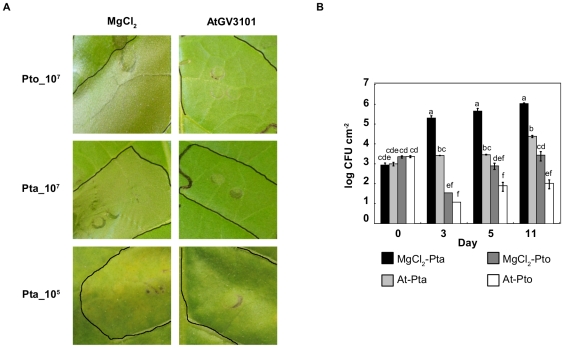
Background: Agrobacterium tumefaciens strain GV3101 (pMP90) is widely used in transient gene expression assays, including assays to study pathogen effectors and plant disease resistance mechanisms. However, inoculation of A. tumefaciens GV3101 into Nicotiana tabacum (tobacco) leaves prior to infiltration with pathogenic and non-host strains of Pseudomonas syringae results in suppression of macroscopic symptoms when compared with leaves pre-treated with a buffer control.

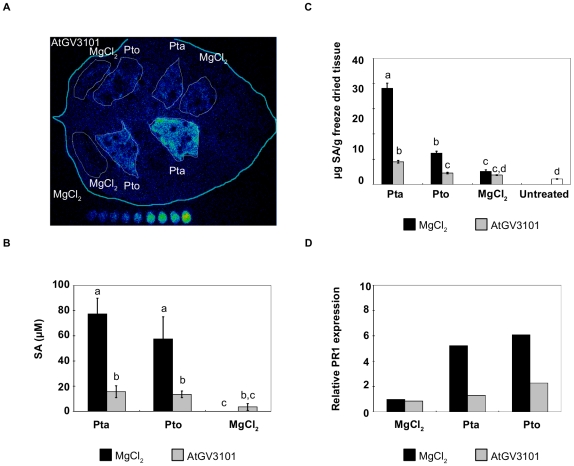
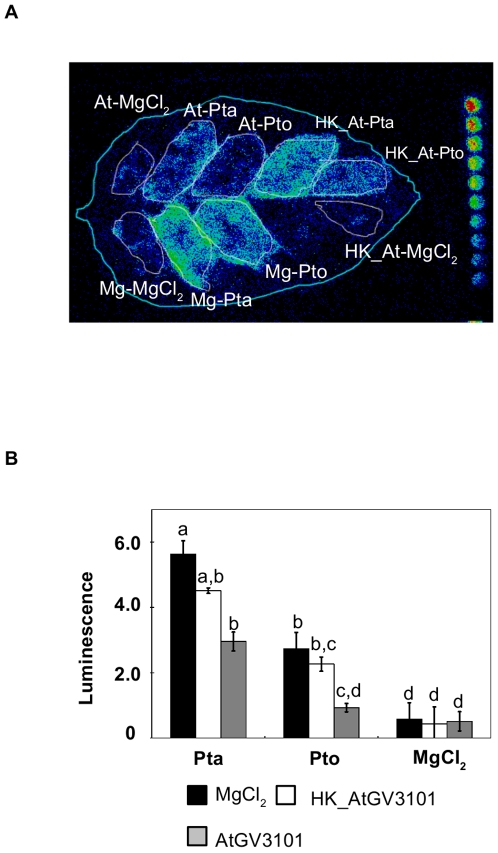
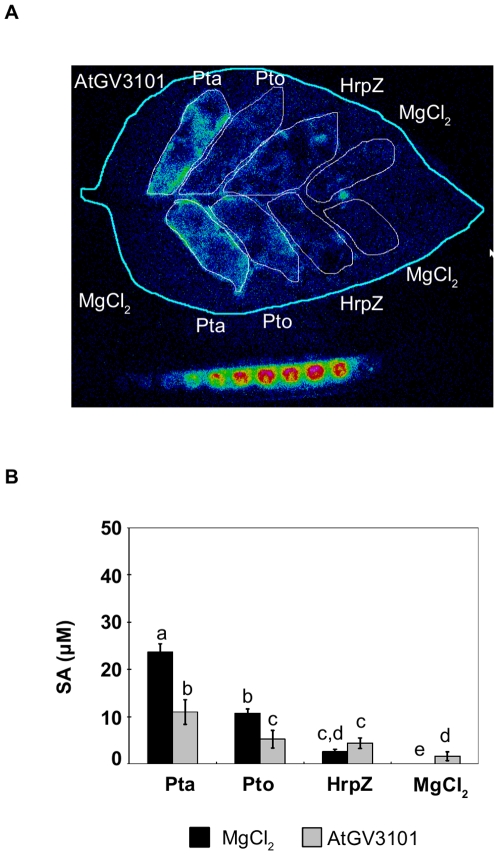
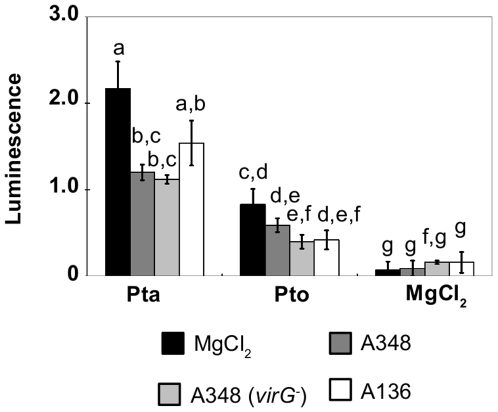
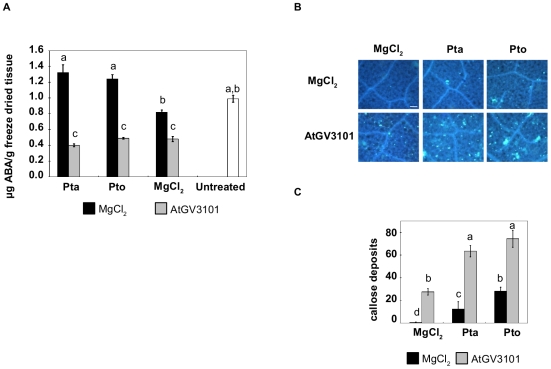
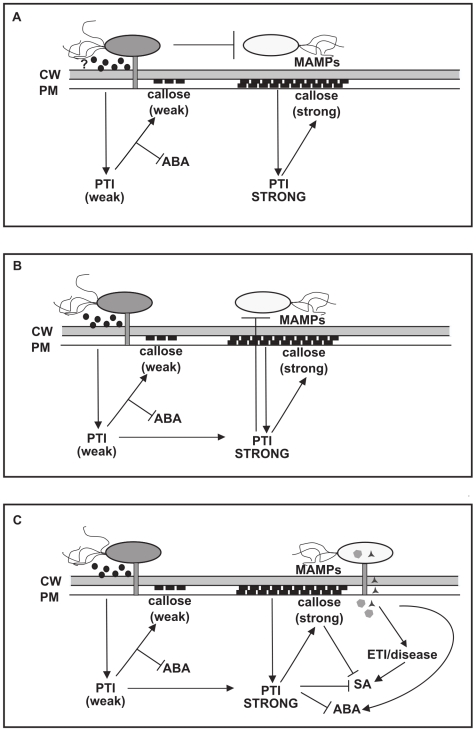
Methodology/findings: To gain further insight into the mechanistic basis of symptom suppression by A. tumefaciens we examined the effect of pre-treatment with A. tumefaciens on the growth of P. syringae, the production of the plant signalling molecules salicylic acid (SA) and abscisic acid (ABA), and the presence of callose deposits. Pre-treatment with A. tumefaciens reduced ABA levels, P. syringae multiplication and P. syringae-elicited SA and ABA production, but promoted increased callose deposition. However, pre-treatment with A. tumefaciens did not suppress necrosis or SA production in leaves inoculated with the elicitor HrpZ.

Conclusions/significance: Collectively, these results show that inoculation of N. tabacum leaves with A. tumefaciens alters plant hormone levels and plant defence responses to P. syringae, and demonstrate that researchers should consider the impact of A. tumefaciens on plant signal transduction when using A. tumefaciens-mediated transient expression assays to investigate ABA-regulated processes or pathogenicity and plant defence mechanisms.


Conflict of interest statement

Competing Interests: The authors have declared that no competing interests exist.

Figures

Figure 1
Figure 1. Agroinfiltration of N. tabacum leaves prior to P. syringae infection reduces macroscopic symptoms and P. syringae growth.
A. N. tabacum leaves were infiltrated with 10 mM MgCl2(AS) (MgCl2) or A. tumefaciens GV3101 (AtGV3101) at 107 cfu/ml. P. syringae pv. tabaci 11528 (Pta) and P. s. pv. tomato DC3000 (Pto) were infiltrated 48 hours later at 107 cfu/ml. Images show infiltrated areas from representative leaves photographed 24 hours after inoculation with Pta and Pto at 107 cfu/ml, (top panels) or 6 days after inoculation with Pta at 105 cfu/ml (bottom panels). B. N. tabacum leaves were inoculated with 10 mM MgCl2(AS) or AtGV3101 as described in A, followed 48 hours later by inoculation with P. syringae at 105 cfu/ml. Population densities of P. syringae were estimated at 0, 3, 5 and 11 days after inoculation by dilution plating of homogenised leaf extracts onto selective media. CFU, colony forming units; MgCl2-Pta, Pta population density after MgCl2(AS) treatment; MgCl2-Pto, Pto population density after MgCl2(AS) treatment; At-Pta, Pta population density after AtGV3101 treatment; At-Pto, Pto population density after AtGV3101 treatment. Data shown is the average of three replicates. Error bars show standard deviation. General Linear Model (GLM) analysis revealed statistical differences between treatments (F = 56.4244; p<0.0001; df = 15). Means with the same letter were not significantly different at the 5% confidence level based on Tukey's Honestly Significant Mean Differences (HSD) Test. The experiment was performed twice with similar results.
Figure 2
Figure 2. Agroinfiltration of N. tabacum leaves prior to P. syringae infection reduces P. syringae-elicited salicylic acid (SA) production and PR1a expression.
In all experiments, leaves were inoculated with A. tumefaciens GV3101 (AtGV3101) at 107 cfu/ml or MgCl2(AS), followed by inoculation with P. syringae pv. tabaci 11528 (Pta) or P. s. pv. tomato DC3000 (Pto) at 105 cfu/ml or with MgCl2 after 48 hours. A. The leaf shown was inoculated with AtGV3101 (top panels) and MgCl2 (bottom panels). The SA biosensor ADPWH-lux was inoculated into leaves 24 hours after infiltration with P. syringae. SA-induced luminescence was measured one hour after biosensor inoculation using a photon-counting camera. In vitro SA concentration ladders were included with each leaf imaged to allow comparison of bioluminescence between separate images. B. Numerical SA values for leaves inoculated with ADPWH-lux were calculated using a calibration curve as described in Huang et al. . The chart shows average SA values from three independent experiments. GLM analysis revealed statistical differences between treatments (F = 23.6361; p<0.0001; df = 5). Means with the same letter were not significantly different at the 5% confidence level based on Tukey's HSD Test. C. SA levels in whole leaf extracts. SA content was determined by LC/MS/MS as described by Forcat et al. The graph shows average values from five independent experiments. One way ANOVA revealed statistical differences between treatments (F = 24.9968; p<0.0001; df = 6). Means with the same letter were not significantly different at the 5% confidence level based on Student's t-test. Bars indicate the standard error of the mean. D. PR1a expression relative to the housekeeping gene EF1-α measured by quantitative real-time PCR. The figure shows a representative experiment. Similar ratios of PR1a expression in agroinfiltrated leaves with respect to mock-treated leaves were observed in three separate experiments.
Figure 3
Figure 3. Heat-killed A. tumefaciens suppresses P. syringae-elicited SA production to a lesser extent than live A. tumefaciens.
A. The leaf shown was inoculated with A. tumefaciens GV3101 (AtGV3101 107 cfu/ml), heat-killed AtGV3101 (HK_At) or 10 mM MgCl2(AS) (Mg), followed by inoculation with P. syringae pv. tabaci 11528 (Pta), P. s. pv. tomato DC3000 (Pto) (105 cfu/ml) or 10 mM MgCl2 after 48 hours. The SA biosensor ADPWH-lux was inoculated into leaves 24 hours after infiltration with P. syringae. SA-induced luminescence was measured one hour after biosensor inoculation using a photon-counting camera. B. Absolute lux values were normalized against the infiltrated area. The bars show the average normalized luminescence values from three leaves. Error bars show standard deviation. General Linear Model (GLM) analysis revealed statistical differences between treatments (F = 81.2673; p<0.0001; df = 26). Means with the same letter were not significantly different at the 5% confidence level based on Tukey's HSD Test.
Figure 4
Figure 4. A. tumefaciens is unable to suppress HrpZ-elicited SA production.
A. The leaf shown was inoculated with A. tumefaciens GV3101 (AtGV3101 107 cfu/ml), or 10 mM MgCl2(AS) (Mg), followed by inoculation with P. syringae pv. tabaci 11528 (Pta), P. s. pv. tomato DC3000 (Pto) (105 cfu/ml), HrpZ (0.1 mg/ml) or 10 mM MgCl2 after 48 hours. The SA biosensor ADPWH-lux was inoculated into leaves 24 hours after infiltration with P. syringae or HrpZ. SA-induced luminescence was measured one hour after biosensor inoculation using a photon-counting camera. B. Numerical SA values were calculated using a calibration curve as described in Huang et al. . The bars show the average SA values from three independent experiments. Bars show standard error of the mean. General Linear Model (GLM) analysis revealed statistical differences between treatments (F = 22.4936; p<0.0001; df = 23). Means with the same letter were not significantly different at the 5% confidence level based on Student's t test.
Figure 5
Figure 5. A. tumefaciens strains lacking virG and pTi are able to suppress SA production in N. tabacum.
Tobacco leaves were inoculated with wild type A. tumefaciens A348 (dark grey bars), A348 (virG-) (pale grey bars), the pTi lacking derivative A136 (white bars) (all at 107 cfu/ml) or 10 mM MgCl2(AS) (black bars), followed by inoculation with P. syringae pv. tabaci 11528 (Pta) or P. s. pv. tomato DC3000 (Pto) (105 cfu/ml) after 48 hours. The SA biosensor ADPWH-lux was inoculated into leaves 24 hours after infiltration with P. syringae. SA-induced luminescence was measured one hour after biosensor inoculation using a photon-counting camera and absolute lux values were normalized against the infiltrated area. Error bars show standard error of the mean. General Linear Model (GLM) analysis revealed statistical differences between treatments (F = 21.0735; p<0.0001; df = 50). Means with the same letter were not significantly different at the 5% confidence level based on least square (LS) means using Student's t-test. The experiment was performed at least twice with similar results.
Figure 6
Figure 6. Agroinfiltration decreases ABA levels and primes callose deposition in N. tabacum.
Leaves were inoculated with A. tumefaciens GV3101 (AtGV3101) at 107 cfu/ml or with 10 mM MgCl2(AS), followed 48 hours later by P. syringae pv. tabaci 11528 (Pta) or P. s. pv. tomato DC3000 (Pto) at 105 cfu/ml, or 10 mM MgCl2. A. ABA levels were determined for whole leaf samples by LC/MS/MS. The graphs show average values from five independent experiments. The bars indicate the standard error of the mean. One way ANOVA revealed statistical differences between treatments (F = 11.1058; p<0.0001; df = 6). Means with the same letter were not significantly different at the 5% confidence level based on Student's t-test. B. Leaf sections were excised 24 hours after infiltration with P. syringae, stained with aqueous aniline blue, and imaged under ultraviolet excitation at 370 nm. Pictures are representative of five areas of 1.3 mm2 taken from a leaf section. Two sections from two leaves were stained in each experiment and the experiment was performed twice with similar results. Scale bar, 100 µm. C. Average callose deposits per field of view (1.3 mm2). The bars indicate the standard error of the mean. GLM revealed statistical differences between treatments (F = 58.7652; p<0.0001; df = 5). Means with the same letter were not significantly different at the 5% confidence level based on Tukey's HSD Test.
Figure 7
Figure 7. Potential mechanisms underlying the effect of A. tumefaciens on P. syringae-plant interactions.
(A) A. tumefaciens inhibits proliferation or virulence gene expression in P. syringae. The presence of high densities of A. tumefaciens in the plant apoplast could have a direct inhibitory effect on proliferation and virulence gene expression in P. syringae. This, in turn, could enhance PAMP-triggered immunity (PTI) elicited by P. syringae MAMPS and suppress SA production. Infiltration of AtGV3101 also enhances some basal defence responses and ABA levels are reduced. (B) A. tumefaciens-mediated priming of the basal immune response inhibits proliferation or virulence gene expression in P. syringae. The observation that heat-killed AtGV3101 partially suppresses P. syringae-elicited SA argues against a direct interaction between AtGV3101 and P. syringae as the sole cause for SA suppression and enhanced expression of basal defences. An alternative explanation would be that AtGV3101 primes for an enhanced basal immune response, which has a negative effect on the ability of P. syringae to suppress PTI, and on the ability of P. syringae to elicit salicylic acid (SA) synthesis as a result of effector-triggered immunity (ETI) or disease. (C) A. tumefaciens-mediated priming of the basal immune response suppresses SA and ABA synthesis. In addition to inhibiting the activities of P. syringae, an enhanced basal immune response could directly suppress both SA and ABA synthesis. CW: cell wall; PM: plasma membrane; ABA: abscisic acid; MAMPs: microbe-associated molecular patterns.

Similar articles

Cited by

References

    1. Chilton MD, Drummond MH, Merio DJ, Sciaky D, Montoya AL, et al. Stable incorporation of plasmid DNA into higher plant cells: the molecular basis of crown gall tumorigenesis. Cell. 1977;11:263–271. - PubMed
    1. Van Larebeke N, Engler G, Holsters M, Van den Elsacker S, Zaenen I, et al. Large plasmid in Agrobacterium tumefaciens essential for crown gall-inducing ability. Nature. 1974;252:169–170. - PubMed
    1. Ditt RF, Nester EW, Comai L. Plant gene expression response to Agrobacterium tumefaciens. Proc Natl Acad Sci USA. 2001;98:10954–10959. - PMC - PubMed
    1. Hellens R, Mullineaux P, Klee H. A guide to Agrobacterium binary Ti vectors. Trends Plant Sci. 2000;5:446–451. - PubMed
    1. Vaquero C, Sack M, Chandler J, Drossard J, Schuster F, et al. Transient expression of a tumor-specific single-chain fragment and a chimeric antibody in tobacco leaves. Proc Natl Acad Sci USA. 1999;96:11128–11133. - PMC - PubMed

Publication types

MeSH terms