. 2010 Jan 29;5(1):e8970.
doi: 10.1371/journal.pone.0008970.

Shorter exposures to harder X-rays trigger early apoptotic events in Xenopus laevis embryos

Affiliations

Shorter exposures to harder X-rays trigger early apoptotic events in Xenopus laevis embryos

JiaJia Dong et al. PLoS One. .

Abstract

Background: A long-standing conventional view of radiation-induced apoptosis is that increased exposure results in augmented apoptosis in a biological system, with a threshold below which radiation doses do not cause any significant increase in cell death. The consequences of this belief impact the extent to which malignant diseases and non-malignant conditions are therapeutically treated and how radiation is used in combination with other therapies. Our research challenges the current dogma of dose-dependent induction of apoptosis and establishes a new parallel paradigm to the photoelectric effect in biological systems.

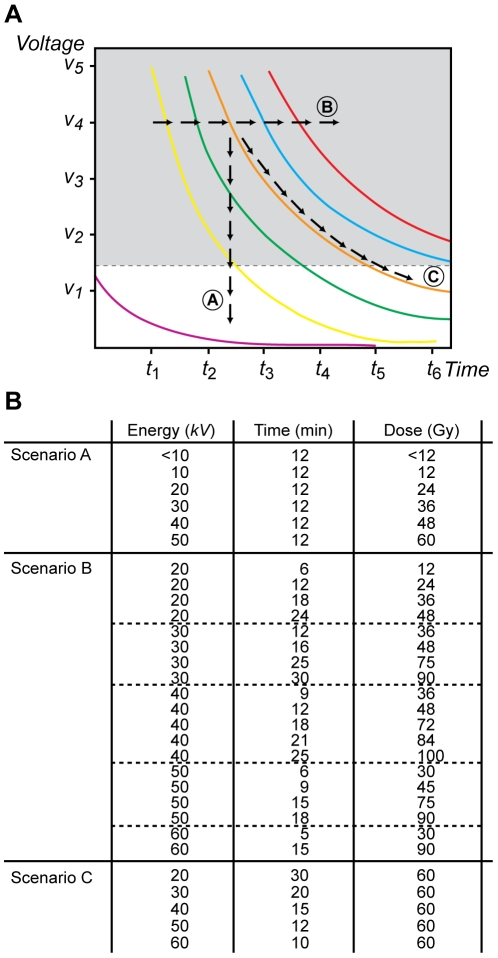
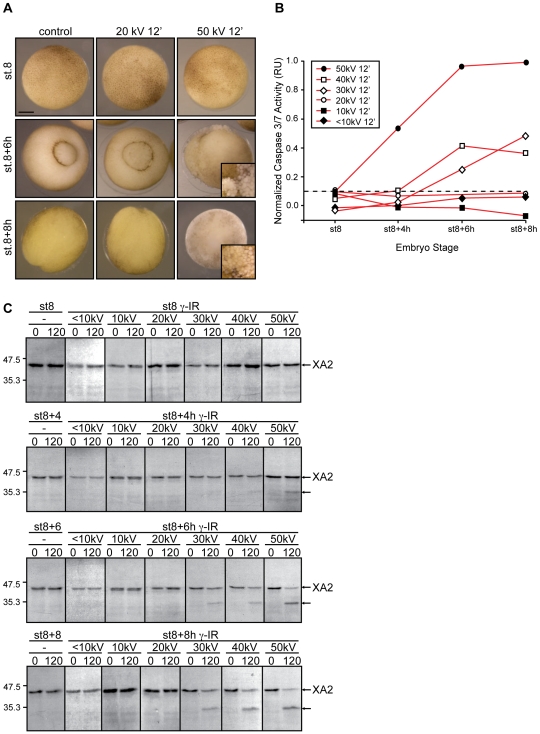
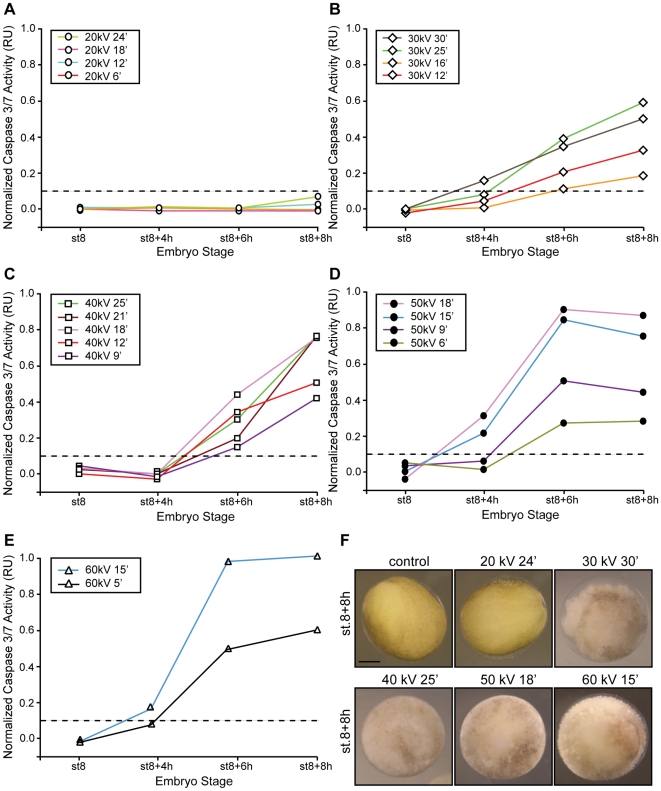
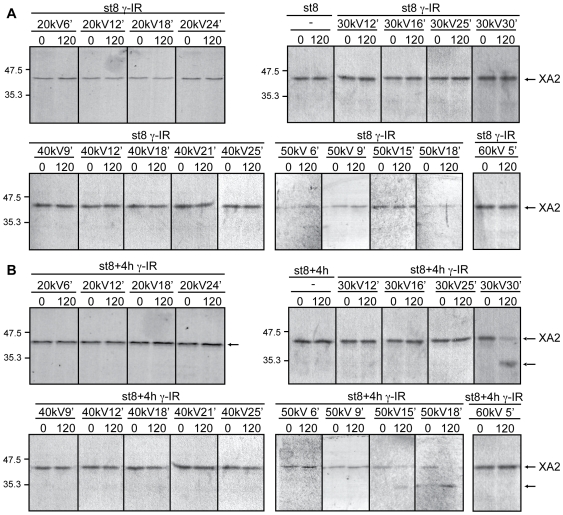
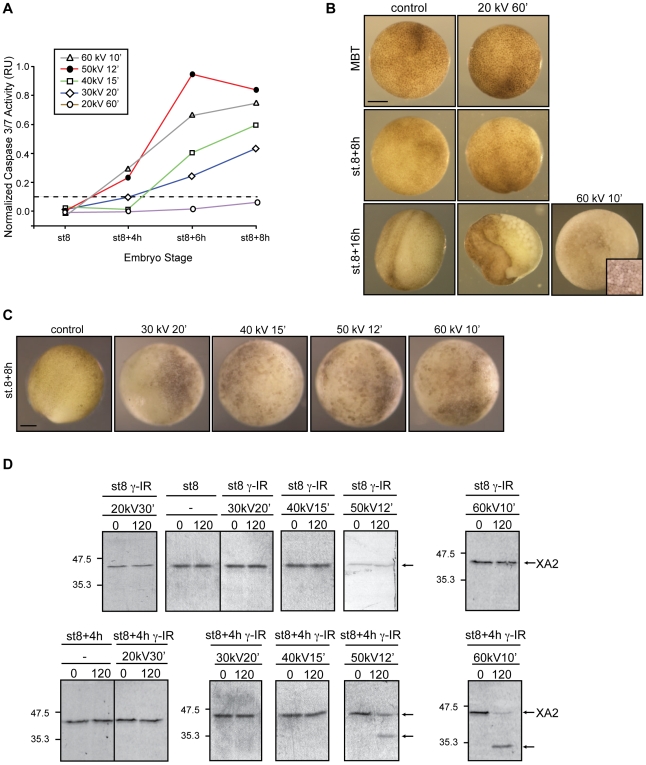
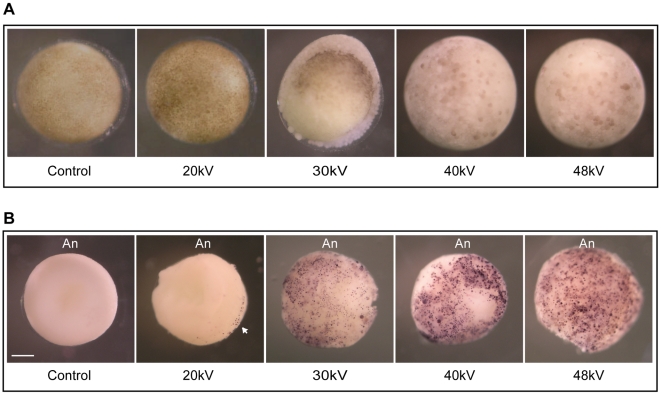
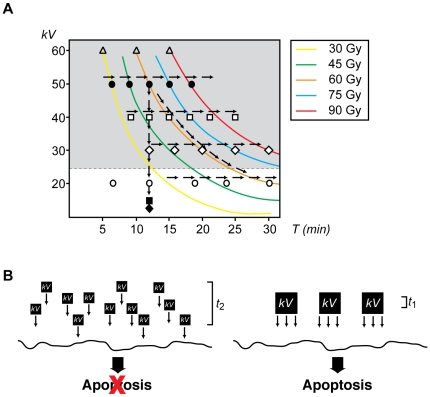
Methodology/principal findings: We explored how the energy of individual X-ray photons and exposure time, both factors that determine the total dose, influence the occurrence of cell death in early Xenopus embryo. Three different experimental scenarios were analyzed and morphological and biochemical hallmarks of apoptosis were evaluated. Initially, we examined cell death events in embryos exposed to increasing incident energies when the exposure time was preset. Then, we evaluated the embryo's response when the exposure time was augmented while the energy value remained constant. Lastly, we studied the incidence of apoptosis in embryos exposed to an equal total dose of radiation that resulted from increasing the incoming energy while lowering the exposure time.

Conclusions/significance: Overall, our data establish that the energy of the incident photon is a major contributor to the outcome of the biological system. In particular, for embryos exposed under identical conditions and delivered the same absorbed dose of radiation, the response is significantly increased when shorter bursts of more energetic photons are used. These results suggest that biological organisms display properties similar to the photoelectric effect in physical systems and provide new insights into how radiation-mediated apoptosis should be understood and utilized for therapeutic purposes.


Conflict of interest statement

Competing Interests: The authors have declared that no competing interests exist.

Figures

Figure 1
Figure 1. The energy-dependent hypothesis of apoptosis induction.
A. Schematic representation of different paths in the space of control parameters (kV, T) used in our experiments. Here, we assumed that the energy of each photon (ε) generated by the X-ray source increases along with the voltage setting (kV) whereas its current (j) remains fixed. Thus, the total exposure (E) at which an embryo is subjected at any given time is proportional to kV x T. Three different scenarios are denoted and were tested: (Scenario A) E increases a as result of augmenting the energy of the photon ε and, therefore, kV while maintaining the exposure time (T) constant; (B) E increases by augmenting T while keeping a constant value for kV; and (C) E remains constant throughout all states analyzed as a result of increasing the exposure time (T) while diminishing kV accordingly. Each colored line represents a different total exposure, also named “dose”, E. The dotted line indicates a hypothetical threshold level below which there is not an observable effect of radiation in a biological system. B. Summary of the experimental conditions to be analyzed in order to evaluate the scenarios discussed above.
Figure 2
Figure 2. Apoptosis results from exposure to increased energies.
A. Morphology of Xenopus embryos that are non-irradiated (control) or irradiated (γ-IR) with either 20 kV or 50 kV for 12 min and collected at MBT (st.8) and 6 and 8 h after. Inset shows a higher magnification image of a typical apoptotic morphology from a similar embryo. Scale bar, 250 µm. B. Embryos were irradiated or not (control) before the MBT (st.6) with the indicated amount of energy (<10 kV, 10 kV, 20 kV, 30 kV, 40 kV, 50 kV) for 12 min, collected at st.8 (MBT) and 4, 6 and 8 h after the MBT, and frozen. At the indicated times, samples equivalent to ten embryos were tested for the activity of caspases 3/7 using a specific colorimetric substrate as described in the “Materials and Methods” section. Normalized caspase activity refers to the activity of irradiated samples from which the basal control activity has been subtracted at each time and is expressed in relative units (RU). Points indicate the average of ten embryos at each time stage. The figure shows data from a single experiment that was repeated three times with similar results. The dotted line denotes a threshold of caspase activity from which experimental values falling below correlate with embryo samples lacking an apoptotic response. C. Extracts equivalent to ten embryos collected at the indicated times were incubated with radiolabeled cyclin A2 as described in the “Materials and Methods” section. At the indicated times (0 and 120 min), aliquots were removed and analyzed for cyclin A2 cleavage by SDS-PAGE and autoradiography. Control samples correspond to non-irradiated embryos. Arrows on the right denote radiolabeled Xenopus cyclin A2 (XA2) and its cleaved form. Molecular mass markers (in kDa) are indicated on the left.
Figure 3
Figure 3. A minimum energy value is required to trigger apoptosis.
Embryos were irradiated (γ-IR) or not (control) before the MBT (st.6) with either 20 kV (A), 30 kV (B), 40 kV (C), 50 kV (D) or 60 kV (E) of energy for the indicated times, collected at st.8 (MBT) and 4, 6 and 8 h after the MBT, and frozen. Samples equivalent to ten embryos were tested for caspases 3/7 activity using a specific colorimetric substrate as described in the “Materials and Methods” section and normalized as described in the legend of Fig. 2. Points indicate the average of ten embryos at each time stage. Results similar to those presented here were observed in three independent experiments. F. Morphology of Xenopus embryos not irradiated (control) or irradiated with 20, 30, 40, 50 kV for 24, 30, 25, 18, 15 min, respectively, and collected 8 h after the MBT. Scale bar, 250 µm.
Figure 4
Figure 4. High-dose radiation raises caspase activity and favors cyclin A2 cleavage.
Extracts equivalent to ten embryos from non-irradiated (control) or irradiated (γ-IR) samples collected at MBT (st.8, A) and 4 h after the MBT (B) were incubated with radiolabeled cyclin A2 as described in the “Materials and Methods” section. Aliquots were removed at the indicated times and analyzed for cyclin A2 cleavage by SDS-PAGE and autoradiography. Control samples correspond to non-irradiated embryos. Arrows on the right denote radiolabeled Xenopus cyclin A2 (XA2) and its cleaved form.
Figure 5
Figure 5. Xenopus embryos exhibit different biological responses to the same dose of radiation.
A. Embryos irradiated (γ-IR) or not (control) before the MBT were collected at the indicated energies and times as summarized in Fig. S2.C. Caspase activity was assayed as described in the legend of Figure 2. Points indicate the average of ten embryos at each time stage. Figure shows data from a single experiment that was repeated three times with similar results. B. Morphology of Xenopus embryos non-irradiated (control) or irradiated with 20 kV for 60 min and collected at MBT (st.8), st.8+8 h and st.8+16 h. For comparison, an embryo treated with 60 kV for 10 min and collected at st.8+16 h is displayed. Inset shows a higher magnification image of typical apoptotic morphology from a similar embryo. C. Morphology of Xenopus embryos non-irradiated (control) or irradiated with 30, 40, 50, 60 kV for 20, 15, 12 and 10 min, respectively, and collected 8 h after the MBT. Scale bar, 250 µm. D. Caspases 3/7 activity were also assessed by cleavage of the radiolabeled cyclin A2 in extracts from control (non-irradiated) or γ-IR with the same total dose as indicated. Arrows on the right denote radiolabeled Xenopus cyclin A2 (XA2) and its cleaved form.
Figure 6
Figure 6. Whole-mount TUNEL assay exposes apoptotic cells in irradiated embryos.
A. Pre-MBT embryos were exposed to different energies 20 kV, 30 kV, 40 kV and 48 kV to equal a total dose of ∼65 Gy. Non-irradiated embryos are referred to as “control”. Six hours after the MBT, embryos were fixed in MEMFA as described in the “Materials and Methods” section and photographed. B. TUNEL staining was performed on fixed embryos to detect DNA fragmentation. Embryos were treated as described in (A). Intense TUNEL staining was detected in the animal pole portion of the embryos. The embryos shown in B are representative of the TUNEL staining observed following analysis of ∼80 embryos of which 20% were stained. Arrowhead points to labeled nuclei. An, animal pole. Scale bar, 250 µm.
Figure 7
Figure 7. The energy-dependent model of the apoptotic response.
A. Summary of all experimental conditions analyzed in this work. Arrows indicate each of the three scenarios tested. Energy was measured in kilovolts (kV) and exposure time (T) in min. Colored lines indicate the same total exposure dose. Symbols indicate various energies tested: ⧫: <10 kV, ▪: 10 kV, ○: 20 kV, ◊: 30 kV, □: 40 kV, •: 50 kV, △: 60 kV. B. Conceptual model for the contribution of energy and exposure time to the induction of apoptosis. Energy (kV) is delivered to the sample in either small (left) or large (right) quantum packages. In our schematic representation, small packages are ¼ the size of the large ones, whereas the exposure time is four times longer (t2 = 4t1) in the model represented on the left, and thus, the total exposure dose is the same in both settings. In our model, apoptosis is exclusively induced when large packages of energy are delivered to the sample even when the total exposure dose is the same in both scenarios.

Similar articles

Cited by

References

    1. Hengartner MO. The biochemistry of apoptosis. Nature. 2000;407:770–776. - PubMed
    1. Rich T, Allen RL, Wyllie AH. Defying death after DNA damage. Nature. 2000;407:777–783. - PubMed
    1. Elmore S. Apoptosis: a review of programmed cell death. Toxicol Pathol. 2007;35:495–516. - PMC - PubMed
    1. Rudin CM, Thompson CB. Apoptosis and disease: regulation and clinical relevance of programmed cell death. Annu Rev Med. 1997;48:267–281. - PubMed
    1. Nijhawan D, Honarpour N, Wang X. Apoptosis in neural development and disease. Annu Rev Neurosci. 2000;23:73–87. - PubMed

Publication types