

Identification of crosstalk between phosphoprotein signaling pathways in RAW 264.7 macrophage cells
- PMID: 20126526
- PMCID: PMC2813256
- DOI: 10.1371/journal.pcbi.1000654
Identification of crosstalk between phosphoprotein signaling pathways in RAW 264.7 macrophage cells
Abstract
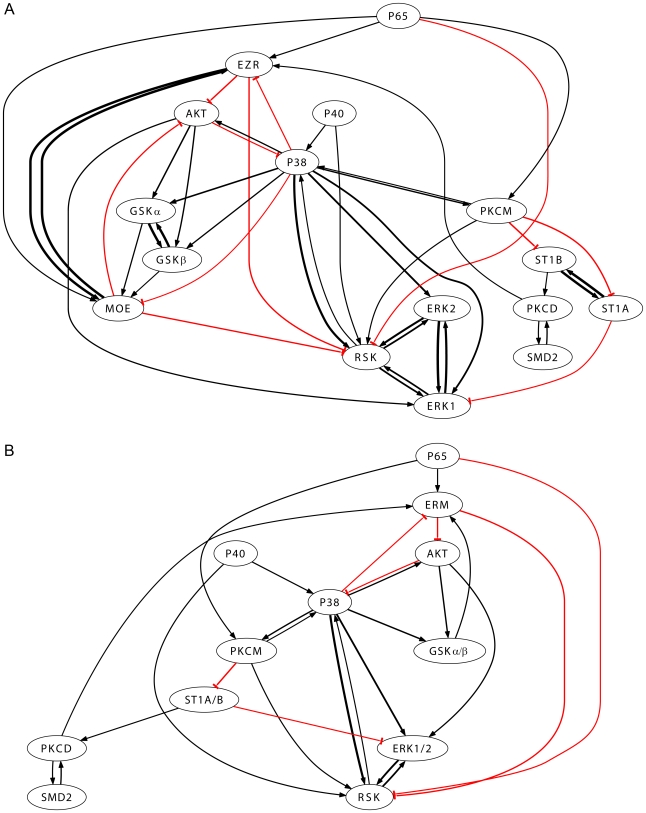
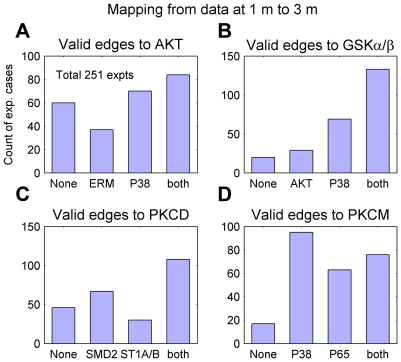
Signaling pathways mediate the effect of external stimuli on gene expression in cells. The signaling proteins in these pathways interact with each other and their phosphorylation levels often serve as indicators for the activity of signaling pathways. Several signaling pathways have been identified in mammalian cells but the crosstalk between them is not well understood. Alliance for Cellular Signaling (AfCS) has measured time-course data in RAW 264.7 macrophage cells on important phosphoproteins, such as the mitogen-activated protein kinases (MAPKs) and signal transducer and activator of transcription (STATs), in single- and double-ligand stimulation experiments for 22 ligands. In the present work, we have used a data-driven approach to analyze the AfCS data to decipher the interactions and crosstalk between signaling pathways in stimulated macrophage cells. We have used dynamic mapping to develop a predictive model using a partial least squares approach. Significant interactions were selected through statistical hypothesis testing and were used to reconstruct the phosphoprotein signaling network. The proposed data-driven approach is able to identify most of the known signaling interactions such as protein kinase B (Akt) --> glycogen synthase kinase 3alpha/beta (GSKalpha/beta) etc., and predicts potential novel interactions such as P38 --> RSK and GSK --> ezrin/radixin/moesin. We have also shown that the model has good predictive power for extrapolation. Our novel approach captures the temporal causality and directionality in intracellular signaling pathways. Further, case specific analysis of the phosphoproteins in the network has led us to propose hypothesis about inhibition (phosphorylation) of GSKalpha/beta via P38.
Conflict of interest statement
The authors have declared that no competing interests exist.
Figures

Similar articles
-
Time-varying causal inference from phosphoproteomic measurements in macrophage cells.IEEE Trans Biomed Circuits Syst. 2014 Feb;8(1):74-86. doi: 10.1109/TBCAS.2013.2288035. IEEE Trans Biomed Circuits Syst. 2014. PMID: 24681921 Free PMC article.
-
Information theoretic approach to complex biological network reconstruction: application to cytokine release in RAW 264.7 macrophages.BMC Syst Biol. 2014 Jun 25;8:77. doi: 10.1186/1752-0509-8-77. BMC Syst Biol. 2014. PMID: 24964861 Free PMC article.
-
Context Specificity in Causal Signaling Networks Revealed by Phosphoprotein Profiling.Cell Syst. 2017 Jan 25;4(1):73-83.e10. doi: 10.1016/j.cels.2016.11.013. Epub 2016 Dec 22. Cell Syst. 2017. PMID: 28017544 Free PMC article.
-
New steps in the Wnt/beta-catenin signal transduction pathway.Recent Prog Horm Res. 2000;55:225-36. Recent Prog Horm Res. 2000. PMID: 11036939 Review.
-
Platelet signal transduction pathways: could we organize them into a 'hierarchy'?Haemostasis. 1999 Sep;29(1):4-15. doi: 10.1159/000022456. Haemostasis. 1999. PMID: 10494030 Review.
Cited by
-
Perturbation biology: inferring signaling networks in cellular systems.PLoS Comput Biol. 2013;9(12):e1003290. doi: 10.1371/journal.pcbi.1003290. Epub 2013 Dec 19. PLoS Comput Biol. 2013. PMID: 24367245 Free PMC article.
-
Time-varying causal inference from phosphoproteomic measurements in macrophage cells.IEEE Trans Biomed Circuits Syst. 2014 Feb;8(1):74-86. doi: 10.1109/TBCAS.2013.2288035. IEEE Trans Biomed Circuits Syst. 2014. PMID: 24681921 Free PMC article.
-
Bioinformatics and systems biology of the lipidome.Chem Rev. 2011 Oct 12;111(10):6452-90. doi: 10.1021/cr200295k. Epub 2011 Sep 23. Chem Rev. 2011. PMID: 21939287 Free PMC article. Review. No abstract available.
-
Systems biology in physiology: the vasopressin signaling network in kidney.Am J Physiol Cell Physiol. 2012 Dec 1;303(11):C1115-24. doi: 10.1152/ajpcell.00270.2012. Epub 2012 Aug 29. Am J Physiol Cell Physiol. 2012. PMID: 22932685 Free PMC article. Review.
-
Histone Signatures Predict Therapeutic Efficacy in Breast Cancer.IEEE Open J Eng Med Biol. 2020 Jan 17;1:74-82. doi: 10.1109/OJEMB.2020.2967105. eCollection 2020. IEEE Open J Eng Med Biol. 2020. PMID: 32412527 Free PMC article.
References
-
- Manning G, Whyte DB, Martinez R, Hunter T, Sudarsanam S. The protein kinase complement of the human genome. Science. 2002;298:1912–1934. - PubMed
-
- Ichijo H. From receptors to stress-activated MAP kinases. Oncogene. 1999;18:6087–6093. - PubMed
-
- Hayden MS, Ghosh S. Shared principles in NF-kappaB signaling. Cell. 2008;132:344–362. - PubMed
-
- Perkins ND. Post-translational modifications regulating the activity and function of the nuclear factor kappa B pathway. Oncogene. 2006;25:6717–6730. - PubMed
Publication types
MeSH terms
Substances
Grants and funding
LinkOut - more resources
Full Text Sources
Research Materials
