FluTE, a publicly available stochastic influenza epidemic simulation model
- PMID: 20126529
- PMCID: PMC2813259
- DOI: 10.1371/journal.pcbi.1000656
FluTE, a publicly available stochastic influenza epidemic simulation model
Abstract
Mathematical and computer models of epidemics have contributed to our understanding of the spread of infectious disease and the measures needed to contain or mitigate them. To help prepare for future influenza seasonal epidemics or pandemics, we developed a new stochastic model of the spread of influenza across a large population. Individuals in this model have realistic social contact networks, and transmission and infections are based on the current state of knowledge of the natural history of influenza. The model has been calibrated so that outcomes are consistent with the 1957/1958 Asian A(H2N2) and 2009 pandemic A(H1N1) influenza viruses. We present examples of how this model can be used to study the dynamics of influenza epidemics in the United States and simulate how to mitigate or delay them using pharmaceutical interventions and social distancing measures. Computer simulation models play an essential role in informing public policy and evaluating pandemic preparedness plans. We have made the source code of this model publicly available to encourage its use and further development.
Conflict of interest statement
The authors have declared that no competing interests exist.
Figures

 ), that person will be infectious for six days with infectiousness proportional to his or her viral load. The six possible viral load trajectories are plotted. Most individuals become symptomatic, which occurs after a 1, 2, or 3 day incubation period. Symptomatic individuals are twice as infectious as asymptomatic individuals (i.e., infectiousness is proportional to twice the viral load). Individuals recover six days after infection and are immune.
 by the age of the index case and the weighted average. (B) Average case generation time vs
  .
.
 and (B) for
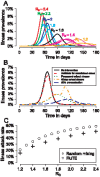
  with various interventions. The interventions, which begin 30 days after the first case is detected, are: giving a course of antiviral agents to ascertained cases, closing schools either permanently or for 60 days, and pre-vaccination of 50% of the population with a well-matched seasonal influenza vaccine. (C) Final illness attack rates (180 days) vs
  for FluTE (simulating metropolitan Seattle) and a model with random mixing. Results for all panels are from one run of metropolitan Seattle for each
  or intervention strategy except for the simulation for
  in panel (A), which was run 5 times with different random number seeds and plotted to show stochastic variability.
 .
.
References
-
- Ross R. Application of the theory of probabilities to the study of a priori pathometry. part I. Proceedings of the Royal Society of London Series A, Containing Papers of a Mathematical and Physical Character. 1916;92:204–230.
-
- Halloran ME, Longini IM, Jr, Nizam A, Yang Y. Containing bioterrorist smallpox. Science. 2002;298:1428–32. - PubMed
-
- Eubank S, Guclu H, Kumar VSA, Marathe MV, Srinivasan A, et al. Modelling disease outbreaks in realistic urban social networks. Nature. 2004;429:180–4. - PubMed
Publication types
MeSH terms
Grants and funding
LinkOut - more resources
Full Text Sources
Other Literature Sources
Medical

