Protein interaction networks--more than mere modules
- PMID: 20126533
- PMCID: PMC2813263
- DOI: 10.1371/journal.pcbi.1000659
Protein interaction networks--more than mere modules
Abstract
It is widely believed that the modular organization of cellular function is reflected in a modular structure of molecular networks. A common view is that a "module" in a network is a cohesively linked group of nodes, densely connected internally and sparsely interacting with the rest of the network. Many algorithms try to identify functional modules in protein-interaction networks (PIN) by searching for such cohesive groups of proteins. Here, we present an alternative approach independent of any prior definition of what actually constitutes a "module". In a self-consistent manner, proteins are grouped into "functional roles" if they interact in similar ways with other proteins according to their functional roles. Such grouping may well result in cohesive modules again, but only if the network structure actually supports this. We applied our method to the PIN from the Human Protein Reference Database (HPRD) and found that a representation of the network in terms of cohesive modules, at least on a global scale, does not optimally represent the network's structure because it focuses on finding independent groups of proteins. In contrast, a decomposition into functional roles is able to depict the structure much better as it also takes into account the interdependencies between roles and even allows groupings based on the absence of interactions between proteins in the same functional role. This, for example, is the case for transmembrane proteins, which could never be recognized as a cohesive group of nodes in a PIN. When mapping experimental methods onto the groups, we identified profound differences in the coverage suggesting that our method is able to capture experimental bias in the data, too. For example yeast-two-hybrid data were highly overrepresented in one particular group. Thus, there is more structure in protein-interaction networks than cohesive modules alone and we believe this finding can significantly improve automated function prediction algorithms.
Conflict of interest statement
The authors have declared that no competing interests exist.
Figures

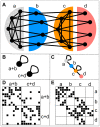
 and
and  are densely connected among themselves. The nodes of type
  have connections to both nodes of types
  and
and  , but not among themselves, i.e. they mediate between types
  and
and  . The nodes of type
  only have connections to nodes of type
  , but not among each other, i.e. they form a periphery to type
  nodes. B and C Two possible image graphs for the functional understanding of this network show the connections among groups of nodes. A typical network clustering will aggregate nodes into clusters densely connected internally but only sparsely connected to the rest, as depicted in the left image graph. This will result in grouping nodes of types
  and
and  together and nodes of type
  and
and  together. Because of aggregating nodes into cohesive groups, any such algorithm will never recognize nodes of type
  and
and  as different and hence miss essential part of the network's structure. On the opposite, the right image graph correctly captures the network structure of the 4 different types as the 4 different nodes in the image graph. D and E The adjacency matrices of our example network with rows and columns ordered according to the two decompositions shown above. A black square in position
  indicates the existence of a link connecting node
  with node
  . Rows and columns are ordered such that nodes in the same group are adjacent. The internal order of the nodes in the groups is random. Each block in the matrix corresponds to a possible edge in the image graph. The left matrix shows the adjacency matrix for the output of a typical clustering algorithm which groups nodes of type
  and
and  , as well as
  and
and  together. Clearly, we see dense blocks along the diagonal and sparse blocks on the off-diagonal of the matrix as expected. The right matrix depicts the adjacency matrix with rows and columns according to the actual types of the nodes. All empty blocks in this matrix correspond to a missing edge in the image graph and all populated blocks are represented by an edge in the image graph. We see that for this network, the image graph perfectly captures the structure of the network.

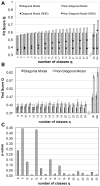
 (4) and
  (5) for the full HPRD dataset with 32,331 interactions. Aggregating nodes into cohesive groups (diagonal image graphs) cannot improve the score beyond a certain limit, while non-diagonal image graphs are able to capture more and more structure as the image graph gets larger and larger. For comparison, the analysis was repeated on a randomized (RND) version of the original network. Standard deviation is smaller than symbol size. The fit scores we obtain on the real data show that the structure we find is far from random. B After removing a test-set of links from the network, we optimized the assignment of nodes into classes according to (2) using only the remaining links and keeping the image graphs fixed to those found in the runs that lead to figure A. With the assignment of nodes into classes for this training set of links, we computed the score on the test set of links. The figure shows average and standard deviation over 10 repetitions of this experiment. C p-values of Student's t-test for a statistically significant difference in the means of the test scores of panel B. For higher numbers of classes and thus larger differences in the fit scores of diagonal and non-diagonal image graphs, all differences become significant at the
  level.
 level after Bonferroni-correction in any of the GO categories biological process, molecular function or cellular compartment. B Number of classes not significantly enriched below the
  level after Bonferroni correction in at least one the GO categories biological process (BP), molecular function (MF) or cellular compartment (CC). Note the different scales. Clearly, the non-diagonal models consistently produce a lower number of classes which are not enriched in functional annotation. This can be seen as an indication that the non-diagonal models not only represent the network better, but the inferred groups also correspond better to known biology.
 classes, we show the adjacency matrix of the HPRD protein interaction network with rows and column ordered to show non-diagonal (A) and diagonal (B) block structure plus the corresponding image graphs for diagonal block models and non-diagonal block models. Note how the non-diagonal models allow to capture overlap between cohesive blocks but also to detect groups of nodes which are non-cohesive but have similar connection patterns to other classes of proteins. The color of the links codes the experiment type: Y2H: grey, in-vitro: blue, in-vitro+Y2H: turquoise, in-vivo: green, in-vivo+Y2H:orange, in-vivo+in-vitro: red, in-vivo+in-vitro+Y2H:black. The dots representing the matrix entries have been enlarged for better visibility.

 classes as used in figure 5 but for 3 different types of interactions, separately. A Interactions reported only for yeast-2-hybrid experiments (grey). B Interactions reported only in in-vitro experiments (blue). C Interactions reported only in in-vivo experiments (green). While in-vitro and in-vivo data is highly correlated, the interactions found in Y2H experiments are enriched in class 8.
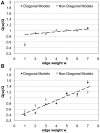
 to
to  ,
,  and
and  , we show the fit scores
  and
and  for each link type individually. Scores are normalized to the fit score obtained on the full data set from which also the assignment of nodes into classes and the image graphs are taken. A Actual HPRD data. Standard deviations are smaller than symbol sizes. B Randomized version of HPRD. As expected, we find the score increasing with weight. In the real data, increase of score with weight is slower, indicating a high correlation between the scores obtained for links representing different experimental techniques. As an exception, interactions with weight one, i.e. representing to Y2H-data only, show a significantly lower score than expected. See text for details.
Similar articles
-
BinTree seeking: a novel approach to mine both bi-sparse and cohesive modules in protein interaction networks.PLoS One. 2011;6(11):e27646. doi: 10.1371/journal.pone.0027646. Epub 2011 Nov 28. PLoS One. 2011. PMID: 22140454 Free PMC article.
-
A novel subgradient-based optimization algorithm for blockmodel functional module identification.BMC Bioinformatics. 2013;14 Suppl 2(Suppl 2):S23. doi: 10.1186/1471-2105-14-S2-S23. Epub 2013 Jan 21. BMC Bioinformatics. 2013. PMID: 23368964 Free PMC article.
-
Identification of functional hubs and modules by converting interactome networks into hierarchical ordering of proteins.BMC Bioinformatics. 2010 Apr 29;11 Suppl 3(Suppl 3):S3. doi: 10.1186/1471-2105-11-S3-S3. BMC Bioinformatics. 2010. PMID: 20438650 Free PMC article.
-
Identifying protein complexes and functional modules--from static PPI networks to dynamic PPI networks.Brief Bioinform. 2014 Mar;15(2):177-94. doi: 10.1093/bib/bbt039. Epub 2013 Jun 18. Brief Bioinform. 2014. PMID: 23780996 Review.
-
Computational prediction of protein-protein interactions.Methods Mol Biol. 2004;261:445-68. doi: 10.1385/1-59259-762-9:445. Methods Mol Biol. 2004. PMID: 15064475 Review.
Cited by
-
Exploring overlapping functional units with various structure in protein interaction networks.PLoS One. 2012;7(8):e43092. doi: 10.1371/journal.pone.0043092. Epub 2012 Aug 20. PLoS One. 2012. PMID: 22916212 Free PMC article.
-
Modelling the yeast interactome.Sci Rep. 2014 Mar 4;4:4273. doi: 10.1038/srep04273. Sci Rep. 2014. PMID: 24589662 Free PMC article.
-
BinTree seeking: a novel approach to mine both bi-sparse and cohesive modules in protein interaction networks.PLoS One. 2011;6(11):e27646. doi: 10.1371/journal.pone.0027646. Epub 2011 Nov 28. PLoS One. 2011. PMID: 22140454 Free PMC article.
-
Topology-function conservation in protein-protein interaction networks.Bioinformatics. 2015 May 15;31(10):1632-9. doi: 10.1093/bioinformatics/btv026. Epub 2015 Jan 20. Bioinformatics. 2015. PMID: 25609797 Free PMC article.
-
The function of communities in protein interaction networks at multiple scales.BMC Syst Biol. 2010 Jul 22;4:100. doi: 10.1186/1752-0509-4-100. BMC Syst Biol. 2010. PMID: 20649971 Free PMC article.
References
Publication types
MeSH terms
Substances
LinkOut - more resources
Full Text Sources
Other Literature Sources

