. 2010 Feb 1;5(2):e8990.
doi: 10.1371/journal.pone.0008990.

Expression map of the human exome in CD34+ cells and blood cells: increased alternative splicing in cell motility and immune response genes

Affiliations

Expression map of the human exome in CD34+ cells and blood cells: increased alternative splicing in cell motility and immune response genes

Sylvie Tondeur et al. PLoS One. .

Abstract

Background: Hematopoietic cells are endowed with very specific biological functions, including cell motility and immune response. These specific functions are dramatically altered during hematopoietic cell differentiation, whereby undifferentiated hematopoietic stem and progenitor cells (HSPC) residing in bone marrow differentiate into platelets, red blood cells and immune cells that exit into the blood stream and eventually move into lymphoid organs or inflamed tissues. The contribution of alternative splicing (AS) to these functions has long been minimized due to incomplete knowledge on AS events in hematopoietic cells.

Principal findings: Using Human Exon ST 1.0 microarrays, the entire exome expression profile of immature CD34+ HSPC and mature whole blood cells was mapped, compared to a collection of solid tissues and made freely available as an online exome expression atlas (Amazonia Exon! : http://amazonia.transcriptome.eu/exon.php). At a whole transcript level, HSPC strongly expressed EREG and the pluripotency marker DPPA4. Using a differential splicing index scheme (dsi), a list of 849 transcripts differentially expressed between hematopoietic cells and solid tissues was computed, that included NEDD9 and CD74. Some of these genes also underwent alternative splicing events during hematopoietic differentiation, such as INPP4B, PTPLA or COMMD6, with varied contribution of CD3+ T cells, CD19+ B cells, CD14+ or CD15+ myelomonocytic populations. Strikingly, these genes were significantly enriched for genes involved in cell motility, cell adhesion, response to wounding and immune processes.

Conclusion: The relevance and the precision provided by this exon expression map highlights the contribution of alternative splicing to key feature of blood cells differentiation and function.


Conflict of interest statement

Competing Interests: The authors have declared that no competing interests exist.

Figures

Figure 1
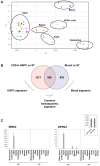
Figure 1. Hematopoietic exome expression analysis at transcript-level.
(A) Global view of gene expression by principal component analysis (PCA) performed on 33 solid tissues samples, 3 mobilized CD34+ hematopoietic stem-progenitor cells (HSPC) and 4 peripheral whole blood samples, on the full probe sets (PS) dataset on Affymetrix Human Exon 1.0 ST microarrays. Blood cells and CD34+ HSPC displayed a distinct spatial localization, in agreement with the very specific expression profile of these cells. Of note, testis and cerebellum could also be individualized based on their global gene expression, whereas all other solid tissues clustered together. Spleen samples localized in an intermediate location, between hematopoietic and solid tissues samples, in agreement with their mixed content of both hematopoietic and non-hematopoietic cells. (B) Venn diagram detailing shared and distinct gene expression among blood cells and HSPC. The “common hematopoietic signature”, was defined as the intersection of the CD34+ HSPC signature (genes overexpressed in CD34+ HSPC compared to solid tissues (ST)) and the whole blood signature (genes overexpressed in blood cells compared to ST). (C) Real-time quantitative RT-PCR (qRT-PCR) validation of overexpression of EREG and DPPA4 genes in HSPC. QRT-PCR were performed on several solid tissues, on whole blood and purified leukocytes and on CD34+ samples (RT+). Results showed specific expression of EREG (left) in CD34+ cells and expression of DPPA4 (right) in HSPC and in 2 human embryonic stem cell (hESC) cell lines, HUES1 and HD90. No Template Control (NTC): qRT-PCR without any nucleic acid sample. RT- : qRT-PCR control without reverse transcriptase, demonstrating the absence of DNA contamination. Results are shown as relative expression signals compared to the less expressive tissue (signal at 1). All qRT-PCR were performed twice.
Figure 2
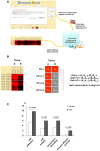
Figure 2. Alternative splicing discovery with exon array.
(A) Exon expression profiles on GeneChip® Human Exon 1.0 ST microarray can be viewed as colored matrices on the Amazonia Exon! web tool. Transcripts are accessed by key words and are visualized as matrices with samples in columns and PS in lines. The exon and PS ID according to Affymetrix numbering are provided. A color code provides the relative or absolute expression level of each exon in each sample. DABG filtering can be performed to exclude background PS. Blood samples and CD34+ HSPC samples are compared to 11 solid tissues. (B) Alternative splicing detection algorithm: pattern searched, corresponding to a differential expression between 2 different tissues (left). Three differential splicing indexes (dsi) were applied. A and B are the mean log signal in tissues A and B in four contiguous PS numbered n, n+1, n+2 and n+3 (right). These dsi were applied to each PS of a gene. A total dsiT for each PS was then computed. (C) Biological function of AS genes in hematopoietic cells. The 849 transcripts of the “hematopoietic AS” list were significantly enriched in genes involved in immune effector processes (P = 0.006), response to wounding (P = 0.003), cell motility (P = 0.001) and cell adhesion (P = 0.0002) The statistical analysis was carried out using the Babelomics webtool (http://babelomics.bioinfo.cipf.es/). Gene Ontology “biological process” categories which differed significantly (P-value≤0.01) between non AS genes (bright bars) and AS genes in hematopoietic cells (dark bars) are shown.
Figure 3
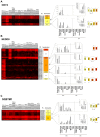
Figure 3. Differential exon expression between hematopoietic cells and solid tissues.
qRT-PCR validation for 3 transcripts differentially expressed between hematopoietic cells and solid tissues: CD74 (A), NEDD9 (B) and SQSTM1 (C). Each transcript is defined with its gene name and transcript number and can be visualized as a colored matrix in Amazonia Exon! web site. Expression level is color coded from no expression (black) to high-level expression (red). The exon and PS ID according to Affymetrix numbering are provided on the right of each matrix. Global gene expression can be visualized on http://amazonia.transcriptome.eu/exon.php. For each transcript, a zoom on the expression matrix obtained in Amazonia Exon! is displayed with PS ID. The correspondence between PS and exon/intron numbering according to GenBank is shown on the right of the cluster (E: exon, I: intron, NA: Not Annotated). Arrows represent PCR primers positions. Experimental validation of alternative splicing events by qRT-PCR in whole blood, leukocytes, CD34+ HSPC cells, breast, cerebellum, heart, liver, muscle, testes and CD3+, CD14+, CD15+, CD19+ positive purified populations (RT+). No Template Control (NTC): qRT-PCR without any nucleic acid sample. RT- : qRT-PCR control without reverse transcriptase, demonstrating the absence of DNA contamination. Results are shown as relative expression signals compared to the less expressive tissue (signal at 1). All qRT-PCR were performed at least twice. (A) Our splicing index discovery scheme led us to detect expression of an intronic sequence in CD74 gene specifically in blood and HSPC. Experimental validation confort this result, showing a part of intron 1 expression in CD15 and CD19+ cells. (B) Exon microarray data showed a long form of NEDD9 specifically expressed in blood cells, whereas a short isoform was detected in all tissues studied. QRT-PCR confirmed that a long form was specifically expressed in blood cells, notably in CD15+ cells. Expression of long parts of intron 2 of NEDD9 gene detected by exon array was also validated by qRT-PCR, suggesting a novel exon due to intron retention. (C) Several PS located in intron 7 of the SQSTM1 gene were expressed according to microarray data. We validated the retention of intron 7 by qRT-PCR, showing an overexpression in CD34 cells.
Figure 4
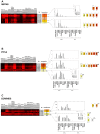
Figure 4. Differential exon expression between whole blood and HSPC: splice isoform switch during hematopoietic differentiation.
Expression matrices and experimental validation of microarray results for INPP4B, PTPLA and COMMD6 (see legend for Figure 3). (A) Exon microarray results for INPP4B gene showed that exons 4, 5, and 6 were under expressed in blood samples compared to CD34+ samples. Interestingly, a PS situated in intron 6 showed an expression similar to that of exon 7, suggesting an exon extension in exon 7 in blood cells and existence of an alternative promoter just upstream of this exon. QRT-PCR results confirmed detection of exons 7 and 8 in whole blood and in leukocytes, notably in CD3+ T-cells, whereas exons 4 and 5 were not expressed in blood samples but detected in CD34 cells. These results point out the absence of a long transcript (including exons 4 and 5) in mature blood cells. (B) The exome expression profile showed that blood express only a short transcript form of PTPLA, limited to exon 1, whereas CD34+ HSPC cells and some solid tissues expressed a long form spanning exon 1 to exon 7. We showed by qRT-PCR that blood and specifically CD3+ and CD15+ cells expressed the short form corresponding to exon1, but not the long form including exon 7. (C) Hematopoietic cells show differential expression of COMMD6 gene: microarray data indicate expression of one unique exon (exon 1) in blood, whereas CD34+ HSPC and other solid tissues expressed transcripts containing exons 3 to 5. This differential expression was confirmed by qRT-PCR, and suggested at least two alternative splicing variants for COMMD6 with a mutually exclusive expression mode during hematopoietic differentiation.

Similar articles

Cited by

References

    1. Moore MJ, Silver PA. Global analysis of mRNA splicing. Rna. 2008;14:197–203. - PMC - PubMed
    1. Cooper TA, Wan L, Dreyfuss G. RNA and disease. Cell. 2009;136:777–793. - PMC - PubMed
    1. Lynch KW. Consequences of regulated pre-mRNA splicing in the immune system. Nat Rev Immunol. 2004;4:931–940. - PubMed
    1. Pritsker M, Doniger TT, Kramer LC, Westcot SE, Lemischka IR. Diversification of stem cell molecular repertoire by alternative splicing. Proc Natl Acad Sci U S A. 2005;102:14290–14295. - PMC - PubMed
    1. Okoniewski MJ, Hey Y, Pepper SD, Miller CJ. High correspondence between Affymetrix exon and standard expression arrays. Biotechniques. 2007;42:181–185. - PubMed

Publication types

MeSH terms

Associated data