. 2010 Feb 1;5(2):e8992.
doi: 10.1371/journal.pone.0008992.

Avian cone photoreceptors tile the retina as five independent, self-organizing mosaics

Affiliations

Avian cone photoreceptors tile the retina as five independent, self-organizing mosaics

Yoseph A Kram et al. PLoS One. .

Abstract

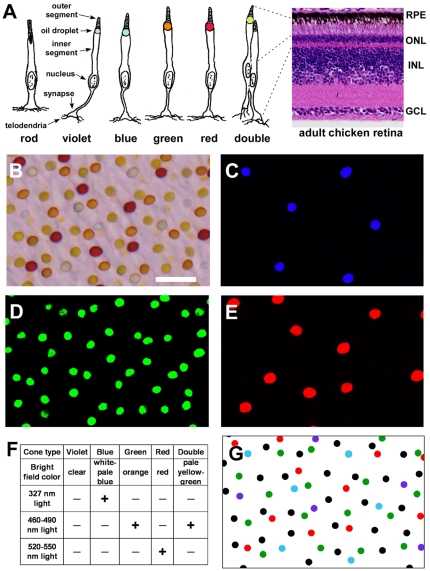
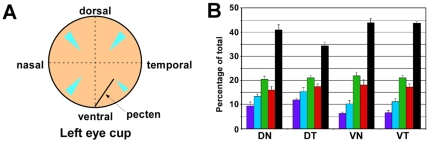
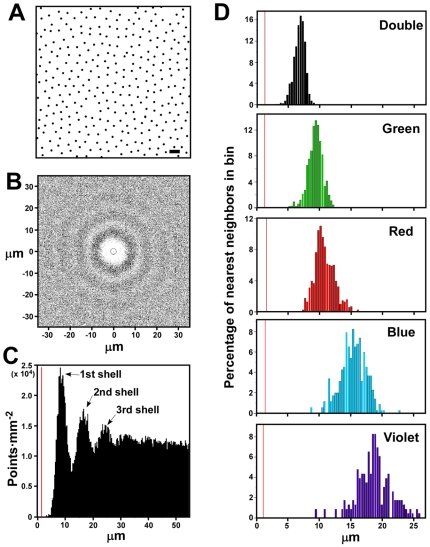
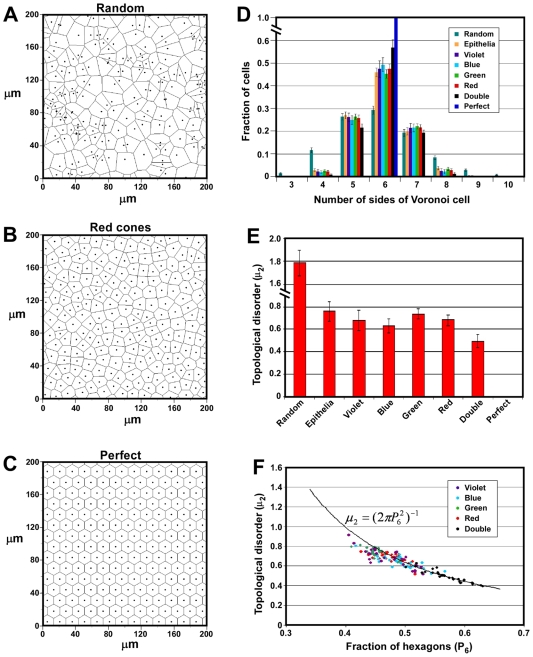
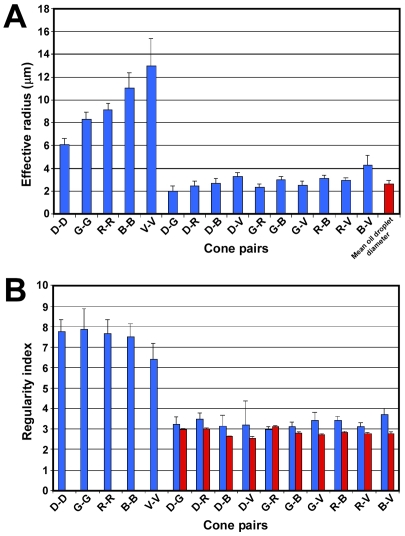
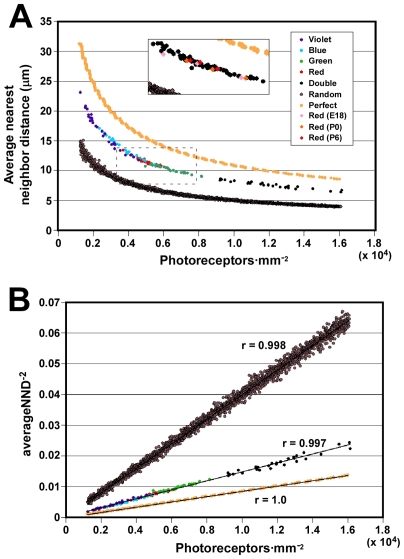
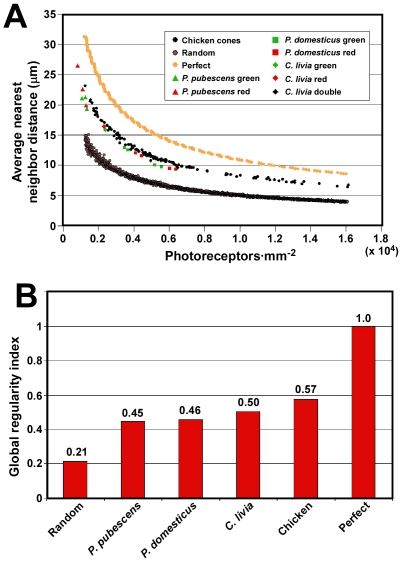
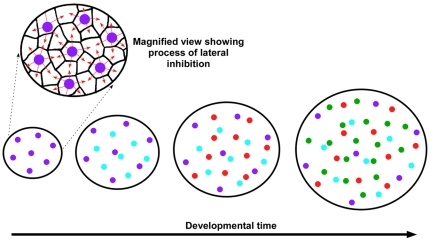
The avian retina possesses one of the most sophisticated cone photoreceptor systems among vertebrates. Birds have five types of cones including four single cones, which support tetrachromatic color vision and a double cone, which is thought to mediate achromatic motion perception. Despite this richness, very little is known about the spatial organization of avian cones and its adaptive significance. Here we show that the five cone types of the chicken independently tile the retina as highly ordered mosaics with a characteristic spacing between cones of the same type. Measures of topological order indicate that double cones are more highly ordered than single cones, possibly reflecting their posited role in motion detection. Although cones show spacing interactions that are cell type-specific, all cone types use the same density-dependent yardstick to measure intercone distance. We propose a simple developmental model that can account for these observations. We also show that a single parameter, the global regularity index, defines the regularity of all five cone mosaics. Lastly, we demonstrate similar cone distributions in three additional avian species, suggesting that these patterning principles are universal among birds. Since regular photoreceptor spacing is critical for uniform sampling of visual space, the cone mosaics of the avian retina represent an elegant example of the emergence of adaptive global patterning secondary to simple local interactions between individual photoreceptors. Our results indicate that the evolutionary pressures that gave rise to the avian retina's various adaptations for enhanced color discrimination also acted to fine-tune its spatial sampling of color and luminance.


Conflict of interest statement

Competing Interests: The authors have declared that no competing interests exist.

Figures

Figure 1
Figure 1. Oil droplets permit classification of chicken cone photoreceptors.
(A) Diagram of the seven photoreceptor cell types of the chicken retina. Oil droplets are colored approximately according to their appearance under brightfield illumination. Rods and the accessory member of double cones lack oil droplets. A hematoxylin and eosin-stained section of an adult chicken retina is shown on the right. The drawing are based on depictions of avian rods and cones by Ramón y Cajal . RPE, retinal pigment epithelium; ONL, outer nuclear layer; INL, inner nuclear layer; GCL, ganglion cell layer. (B) Brightfield view of a flatmounted P15 chicken retina viewed photoreceptor side up. Size bar = 10 µm. (C–E) Same field as in (B) viewed under ultraviolet (327 nm) light (in C), blue (460–490 nm) light (in D) and green (520–550 nm) light (in E). Only blue cones show fluorescence under ultraviolet light, and this fluorescence is short-lived. Both green cones and double cones fluoresce under blue light. Only red cones fluoresce under green light. (F) Table summarizing the appearance of chicken oil droplets under brightfield and fluorescent light. (G) Digitized versions of the field shown in (B). Colored dots correspond to their respective single cone types. Black dots represent double cones.
Figure 2
Figure 2. Cone photoreceptor types are present in characteristic ratios.
(A) Diagram of a chicken eye cup showing the regions of the mid-peripheral retina (in light blue) from which all fields analyzed in this study were derived. (B) Percentages of cone types from each of four quadrants (n = 7 fields for each quadrant). Data for violet, blue, green and red cones are colored accordingly. Data for double cones are shown in black. Error bars indicate SD.
Figure 3
Figure 3. Cone photoreceptors tile the retina as five overlapping mosaics.
(A) Digitized image of double cone distribution in a portion of a single field (dorsal-nasal field 7 in Table S1). Size bar = 10 µm. (B) Spatial autocorrelogram for entire field of double cones of which a portion is shown in (A). The circle around the origin indicates the diameter of an average double cone oil droplet. (C) Density recovery profile derived from the spatial autocorrelogram in (B). The peaks designated “1st shell” etc. are explained in the main text. The vertical orange line indicates the average diameter of a double cone oil droplet. (D) Distribution of nearest neighbor distances for each of the five cone types within a single retinal field (dorsal-nasal field 7 in Table S1). The vertical orange line indicates the average diameter of the oil droplet corresponding to each of the indicated cone types.
Figure 4
Figure 4. Cone mosaics show a high degree of topological order.
(A–C) Voronoi tessellations of a portion of a red cone field (B) and a random (A) and perfect (C) distribution of points of the same density as in (B). (D) Graph showing the average Pn distributions for all chicken cone types as well as simulated random and perfect distributions. ‘Epithelia’ indicates the average Pn distribution for five different animal and plant epithelia as given in [Ref. 38]. Note that the Pn distribution for the random simulations included a small number of 11-, 12- and 13-sided cells which are not shown. Error bars are SD. (E) Graph showing the topological disorder (μ2) for all five cone types as well as random and perfect distributions. ‘Epithelia’ are as described in (D). Error bars are SD. (F) Graph of P6 vs. topological disorder (μ2) for all 140 P15 cone mosaics examined. The solid curve indicates the value of Lemaître's law (equation shown in the graph) in the range, 0.34<P6<0.66.
Figure 5
Figure 5. Cone mosaics are spatially independent.
(A) Graph of the effective radius between cones of the same type (homotypic pairs) and different types (heterotypic pairs). Also shown for comparison is the average oil droplet diameter for all cone types. ‘D-D’, ‘Double cone-Double cone’; ‘G-G’, ‘Green cone-Green cone’ etc. Error bars are SD. (B) Graph of the nearest neighbor regularity indices for cones of the same type (homotypic pairs) and different types (heterotypic pairs) (blue bars). Also shown are regularity indices for simulated mosaics as described in the main text (red bars). Abbreviations are as in (A). Error bars are SD.
Figure 6
Figure 6. All cone types measure intercone distance with the same yardstick.
(A) Graph of photoreceptor density vs. average nearest neighbor distance for all 140 P15 cone mosaics examined (middle curve). The upper and lower curves are graphs of density vs. average nearest neighbor distance for a series of computer-generated perfect and random distributions, respectively. The inset shows data for the three developmental timepoints (i.e., red cones at E18, P0 and P6). It corresponds to the region of the main graph highlighted with a dotted box except that all P15 chicken datapoints shown in the main graph are shown in black to facilitate visualization of the developmental timepoints. (B) Graph of the same datapoints as in (A) but shown as density vs. the inverse-square of the average nearest neighbor distance. The linear correlation coefficients (r) for the best fit line for each of the three datasets are shown.
Figure 7
Figure 7. A range of bird species show similar cone patterning.
(A) Graph of photoreceptor density vs. average nearest neighbor distance for three additional species of bird representing three different orders. All P15 chicken datapoints are shown in black for clarity. P. pubescens, Picoides pubescens; P. domesticus, Passer domesticus; C. livia, Columba livia. (B) Graph of the global regularity indices for all four bird species examined as well as for computer-generated random and perfect distributions. The global regularity index is the inverse of the slope of the best fit linear curves of the form, y  =  mx, for each of the datasets as shown in Figure S3. All values are normalized to that for perfect which is set equal to one.
Figure 8
Figure 8. A model for the formation of the photoreceptor mosaics of the chicken.
In this model the individual photoreceptor types establish their spacing in a series of temporally discrete waves. The least abundant photoreceptor type (i.e., violet cones) establishes spacing first, possibly via a lateral inhibition mechanism (far left). Then, the next most abundant photoreceptor type, blue cones, establishes its spacing. This process continues until spacing has been established for all photoreceptor types (the diagram only shows the four single cone types). The addition of subsequent waves of photoreceptors results in a relatively uniform expansion of the epithelium and a concomitant ‘spacing out’ of those photoreceptor types whose spacing was established earlier. Since spacing is established in discrete steps, all photoreceptor types can, in principle, employ the same biochemical mechanism to establish spacing.

Similar articles

Cited by

References

    1. Hart NS. Variations in cone photoreceptor abundance and the visual ecology of birds. J Comp Physiol A. 2001;187:685–697. - PubMed
    1. Bowmaker JK, Knowles A. The visual pigments and oil droplets of the chicken retina. Vision Res. 1977;17:755–764. - PubMed
    1. Maier EJ, Bowmaker JK. Colour vision in the passeriform bird, Leothrix lutea: correlation of visual pigment absorbance and oil droplet transmission with spectral sensitivity. J Comp Physiol A. 1993;172:295–301.
    1. Vorobyev M, Osorio D. Receptor noise as a determinant of colour thresholds. Proc R Soc Lond B. 1998;265:351–358. - PMC - PubMed
    1. Campenhausen M, Kirschfeld K. Spectral sensitivity of the accessory optic system of the pigeon. J Comp Physiol A. 1998;183:1–6.

Publication types