

Strain background modifies phenotypes in the ATP8B1-deficient mouse
- PMID: 20126555
- PMCID: PMC2813882
- DOI: 10.1371/journal.pone.0008984
Strain background modifies phenotypes in the ATP8B1-deficient mouse
Abstract
Background: Mutations in ATP8B1 (FIC1) underlie cases of cholestatic disease, ranging from chronic and progressive (progressive familial intrahepatic cholestasis) to intermittent (benign recurrent intrahepatic cholestasis). The ATP8B1-deficient mouse serves as an animal model of human ATP8B1 deficiency.
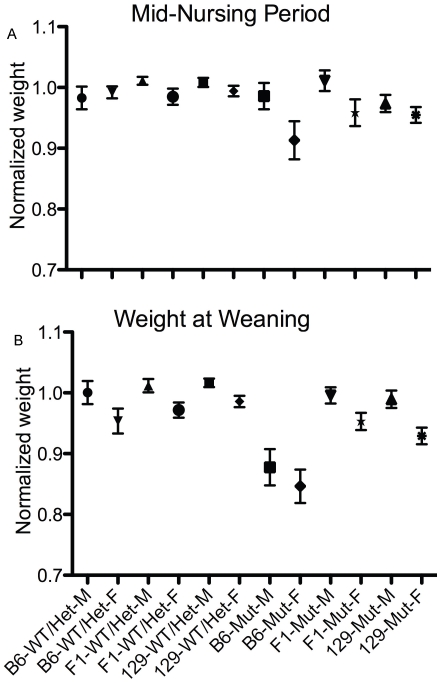
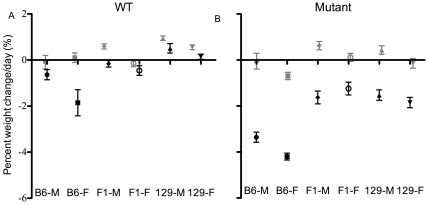
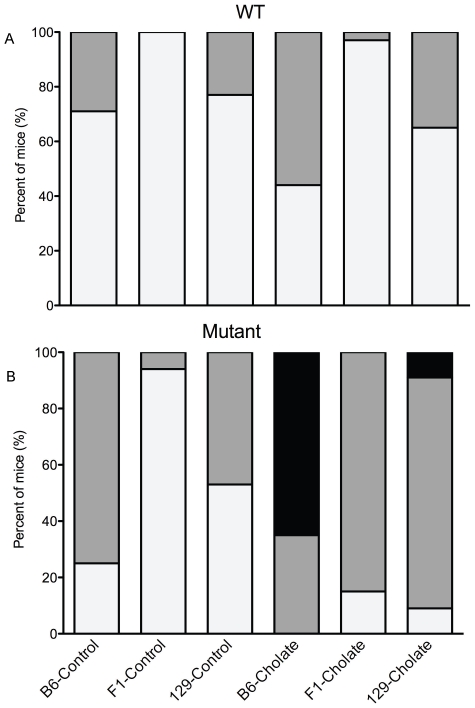
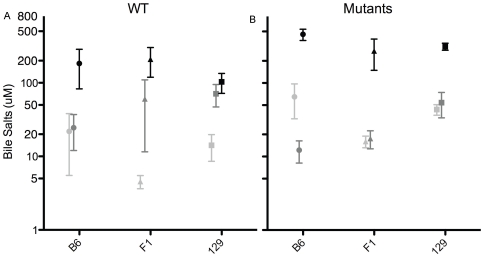
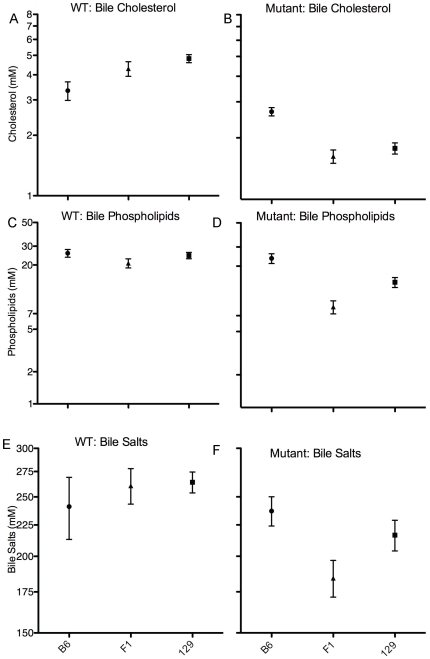
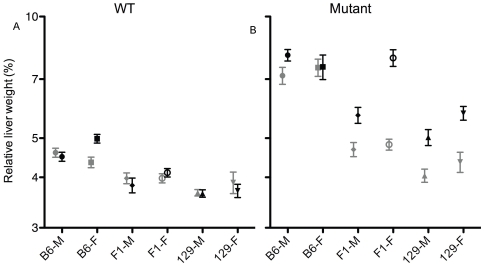
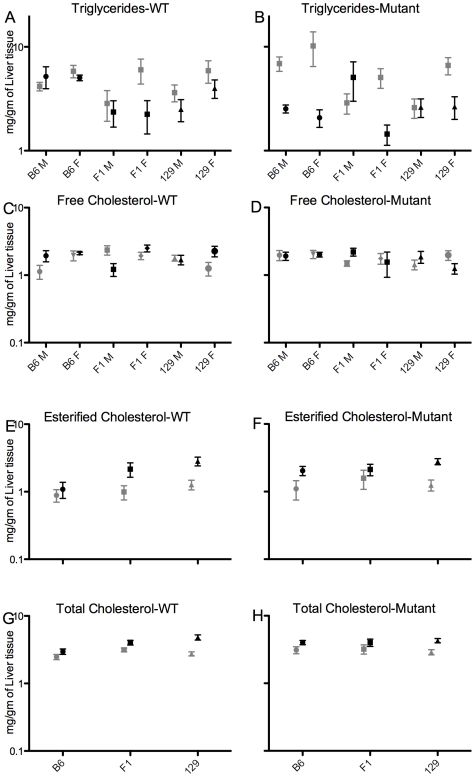
Methodology/principal findings: We investigated the effect of genetic background on phenotypes of ATP8B1-deficient and wild-type mice, using C57Bl/6 (B6), 129, and (B6-129) F1 strain backgrounds. B6 background resulted in greater abnormalities in ATP8B1-deficient mice than did 129 and/or F1 background. ATP8B1-deficient pups of B6 background gained less weight. In adult ATP8B1-deficient mice at baseline, those of B6 background had lower serum cholesterol levels, higher serum alkaline phosphatase levels, and larger livers. After challenge with cholate-supplemented diet, these mice exhibited higher serum alkaline phosphatase and bilirubin levels, greater weight loss and larger livers. ATP8B1-deficient phenotypes in mice of F1 and 129 backgrounds are usually similar, suggesting that susceptibility to manifestations of ATP8B1 deficiency may be recessive. We also detected differences in hepatobiliary phenotypes between wild-type mice of differing strains.
Conclusions/significance: Our results indicate that the ATP8B1-deficient mouse in a B6 background may be a better model of human ATP8B1 deficiency and highlight the importance of informed background strain selection for mouse models of liver disease.
Conflict of interest statement
Figures

Similar articles
-
ATP8B1 and ATP11C: Two Lipid Flippases Important for Hepatocyte Function.Dig Dis. 2015;33(3):314-8. doi: 10.1159/000371665. Epub 2015 May 27. Dig Dis. 2015. PMID: 26045263
-
Hepatic cytochrome P450 deficiency in mouse models for intrahepatic cholestasis predispose to bile salt-induced cholestasis.Lab Invest. 2014 Oct;94(10):1103-13. doi: 10.1038/labinvest.2014.102. Epub 2014 Jul 28. Lab Invest. 2014. PMID: 25068656
-
Intestinal bile salt absorption in Atp8b1 deficient mice.J Hepatol. 2007 Jul;47(1):114-22. doi: 10.1016/j.jhep.2007.02.011. Epub 2007 Mar 7. J Hepatol. 2007. PMID: 17448567
-
Progressive familial intrahepatic cholestasis type 1.Semin Liver Dis. 2010 May;30(2):117-24. doi: 10.1055/s-0030-1253221. Epub 2010 Apr 26. Semin Liver Dis. 2010. PMID: 20422494 Review.
-
FIC1 disease: a spectrum of intrahepatic cholestatic disorders.Semin Liver Dis. 2001 Nov;21(4):535-44. doi: 10.1055/s-2001-19034. Semin Liver Dis. 2001. PMID: 11745041 Review.
Cited by
-
ATP8B1 regulates PIP2 localization and cleavage of pyroptotic executioner Gasdermin D.Proc Natl Acad Sci U S A. 2025 Jun 3;122(22):e2502798122. doi: 10.1073/pnas.2502798122. Epub 2025 May 29. Proc Natl Acad Sci U S A. 2025. PMID: 40440066
-
Intestinal Absorption of Bile Acids in Health and Disease.Compr Physiol. 2019 Dec 18;10(1):21-56. doi: 10.1002/cphy.c190007. Compr Physiol. 2019. PMID: 31853951 Free PMC article. Review.
-
Coat Color-Facilitated Efficient Generation and Analysis of a Mouse Model of Down Syndrome Triplicated for All Human Chromosome 21 Orthologous Regions.Genes (Basel). 2021 Aug 6;12(8):1215. doi: 10.3390/genes12081215. Genes (Basel). 2021. PMID: 34440389 Free PMC article.
-
ATP11C targets basolateral bile salt transporter proteins in mouse central hepatocytes.Hepatology. 2016 Jul;64(1):161-74. doi: 10.1002/hep.28522. Epub 2016 Apr 6. Hepatology. 2016. PMID: 26926206 Free PMC article.
-
Shortened Lifespan and Lethal Hemorrhage in a Hemophilia A Mouse Model.PLoS One. 2016 May 4;11(5):e0154857. doi: 10.1371/journal.pone.0154857. eCollection 2016. PLoS One. 2016. PMID: 27144769 Free PMC article.
References
-
- Bull LN, van Eijk MJ, Pawlikowska L, DeYoung JA, Juijn JA, et al. A gene encoding a P-type ATPase mutated in two forms of hereditary cholestasis. Nat Genet. 1998;18:219–224. - PubMed
-
- Tang X, Halleck MS, Schlegel RA, Williamson P. A subfamily of P-type ATPases with aminophospholipid transporting activity. Science. 1996;272:1495–1497. - PubMed
-
- Folmer DE, Elferink RP, Paulusma CC. P4 ATPases - Lipid flippases and their role in disease. Biochim Biophys Acta. 2009;1791:628–635. - PubMed
-
- Ujhazy P, Ortiz D, Misra S, Li S, Moseley J, et al. Familial intrahepatic cholestasis 1: Studies of localization and function. Hepatology. 2001;34:768–775. - PubMed
Publication types
MeSH terms
Substances
Grants and funding
LinkOut - more resources
Full Text Sources
Molecular Biology Databases
