

Analysis of the molecular networks in androgen dependent and independent prostate cancer revealed fragile and robust subsystems
- PMID: 20126616
- PMCID: PMC2812491
- DOI: 10.1371/journal.pone.0008864
Analysis of the molecular networks in androgen dependent and independent prostate cancer revealed fragile and robust subsystems
Abstract
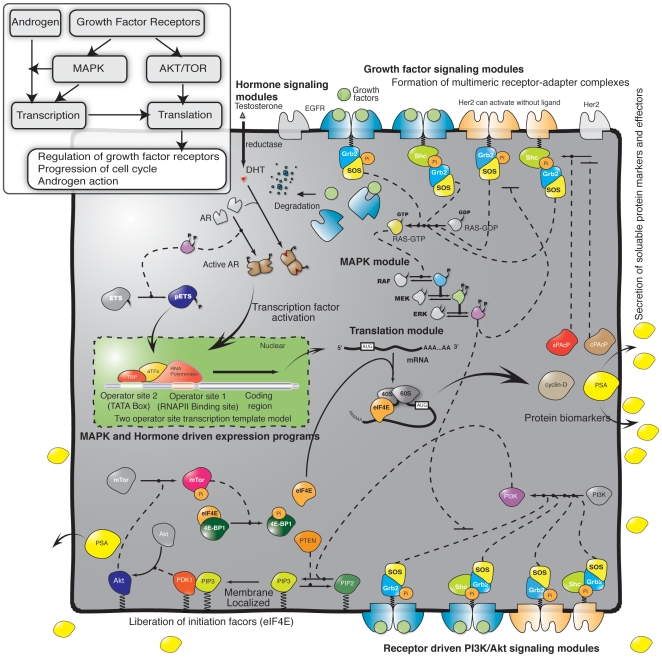
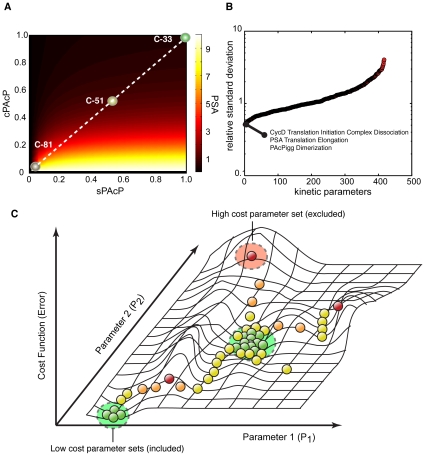
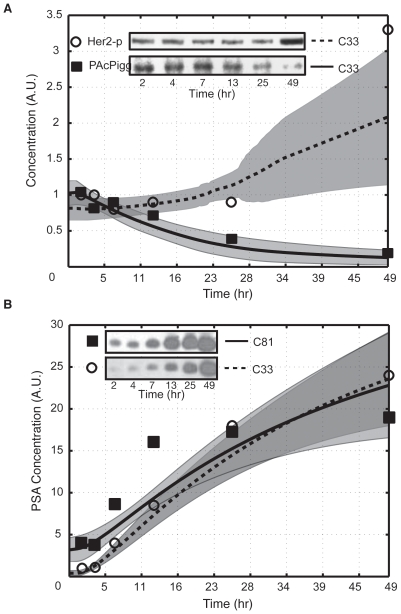
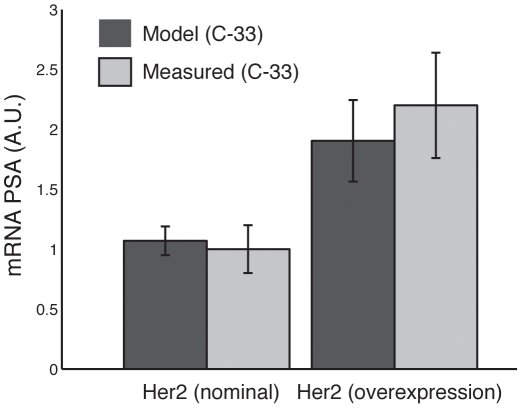
Androgen ablation therapy is currently the primary treatment for metastatic prostate cancer. Unfortunately, in nearly all cases, androgen ablation fails to permanently arrest cancer progression. As androgens like testosterone are withdrawn, prostate cancer cells lose their androgen sensitivity and begin to proliferate without hormone growth factors. In this study, we constructed and analyzed a mathematical model of the integration between hormone growth factor signaling, androgen receptor activation, and the expression of cyclin D and Prostate-Specific Antigen in human LNCaP prostate adenocarcinoma cells. The objective of the study was to investigate which signaling systems were important in the loss of androgen dependence. The model was formulated as a set of ordinary differential equations which described 212 species and 384 interactions, including both the mRNA and protein levels for key species. An ensemble approach was chosen to constrain model parameters and to estimate the impact of parametric uncertainty on model predictions. Model parameters were identified using 14 steady-state and dynamic LNCaP data sets taken from literature sources. Alterations in the rate of Prostatic Acid Phosphatase expression was sufficient to capture varying levels of androgen dependence. Analysis of the model provided insight into the importance of network components as a function of androgen dependence. The importance of androgen receptor availability and the MAPK/Akt signaling axes was independent of androgen status. Interestingly, androgen receptor availability was important even in androgen-independent LNCaP cells. Translation became progressively more important in androgen-independent LNCaP cells. Further analysis suggested a positive synergy between the MAPK and Akt signaling axes and the translation of key proliferative markers like cyclin D in androgen-independent cells. Taken together, the results support the targeting of both the Akt and MAPK pathways. Moreover, the analysis suggested that direct targeting of the translational machinery, specifically eIF4E, could be efficacious in androgen-independent prostate cancers.
Conflict of interest statement
Figures
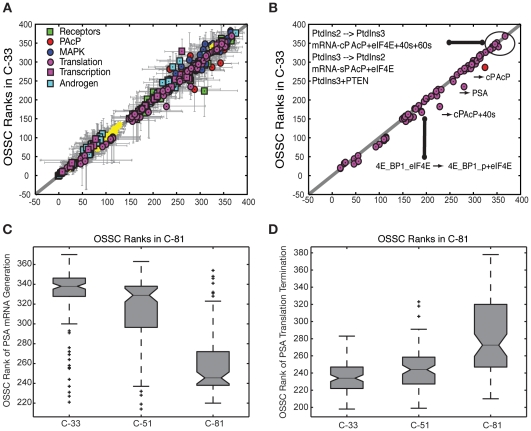
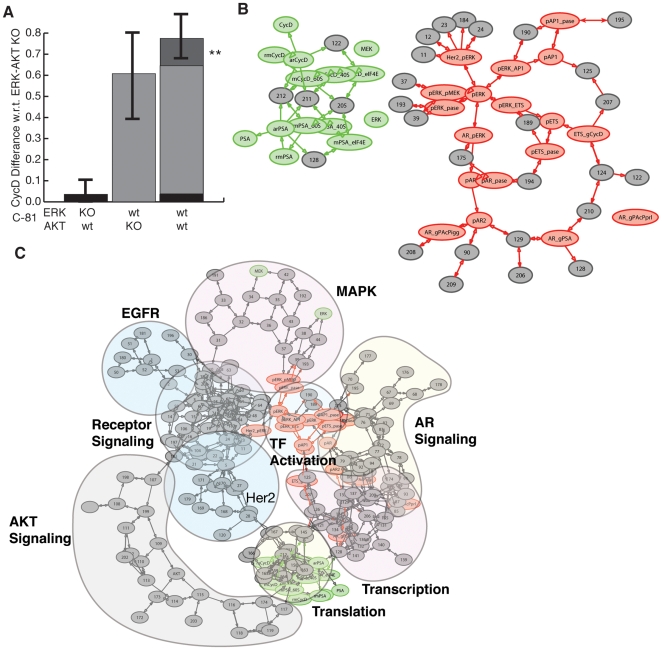
 line are more important in C-33, while shifts to the right show increased importance in C-81. Points are organized by biological function. B: Comparison of the mean OSSC parameter ranks for translation mechanisms (including the role of Akt signaling in translation initiation) in C-33 versus C-81 LNCaP clones. The error bars indicate one standard deviation centered about the mean ensemble value. C: The final mechanism in PSA transcription becomes increasingly more robust w.r.t cancer aggressiveness, as indicated by a significant reduction in mean OSSC Rank. D: The final mechanism in PSA translation (translation termination) was increasingly fragile w.r.t cancer aggressiveness, as indicated by a significant increase in mean OSSC rank. The results indicate a shift in the bottle neck for generation of PSA from transcription to translation as prostate cancer cells lose their androgen dependence. The top and bottom of each box denote the 25th and 75th percentile of the OSSC rank over the parameter ensemble. The center line denotes the median value. Whiskers show the furthest observations and black crosses indicate outliers.
Similar articles
-
Difference in protein expression profile and chemotherapy drugs response of different progression stages of LNCaP sublines and other human prostate cancer cells.PLoS One. 2013 Dec 5;8(12):e82625. doi: 10.1371/journal.pone.0082625. eCollection 2013. PLoS One. 2013. PMID: 24349321 Free PMC article.
-
Ubiquitous mitochondrial creatine kinase is overexpressed in the conditioned medium and the extract of LNCaP lineaged androgen independent cell lines and facilitates prostate cancer progression.Prostate. 2009 Aug 1;69(11):1176-87. doi: 10.1002/pros.20969. Prostate. 2009. PMID: 19415690
-
Piperine, a Bioactive Component of Pepper Spice Exerts Therapeutic Effects on Androgen Dependent and Androgen Independent Prostate Cancer Cells.PLoS One. 2013 Jun 18;8(6):e65889. doi: 10.1371/journal.pone.0065889. Print 2013. PLoS One. 2013. PMID: 23824300 Free PMC article.
-
Sex steroid hormone metabolism and prostate cancer.J Steroid Biochem Mol Biol. 2004 Nov;92(4):281-6. doi: 10.1016/j.jsbmb.2004.10.004. Epub 2004 Dec 19. J Steroid Biochem Mol Biol. 2004. PMID: 15663991 Review.
-
Androgen action in prostate cancer.Horm Cancer. 2010 Oct;1(5):223-8. doi: 10.1007/s12672-010-0044-4. Horm Cancer. 2010. PMID: 21761368 Free PMC article. Review.
Cited by
-
Reduced order modeling and analysis of the human complement system.PLoS One. 2017 Nov 20;12(11):e0187373. doi: 10.1371/journal.pone.0187373. eCollection 2017. PLoS One. 2017. PMID: 29155837 Free PMC article.
-
Development of a diffusion-based mathematical model for predicting chemotherapy effects.Annu Int Conf IEEE Eng Med Biol Soc. 2014;2014:2480-3. doi: 10.1109/EMBC.2014.6944125. Annu Int Conf IEEE Eng Med Biol Soc. 2014. PMID: 25570493 Free PMC article.
-
The essential role of Giα2 in prostate cancer cell migration.Mol Cancer Res. 2012 Oct;10(10):1380-8. doi: 10.1158/1541-7786.MCR-12-0219. Epub 2012 Aug 30. Mol Cancer Res. 2012. PMID: 22936789 Free PMC article.
-
Multiscale models of breast cancer progression.Ann Biomed Eng. 2012 Nov;40(11):2488-500. doi: 10.1007/s10439-012-0655-8. Epub 2012 Sep 25. Ann Biomed Eng. 2012. PMID: 23008097 Free PMC article. Review.
-
Simultaneous targeting of androgen receptor (AR) and MAPK-interacting kinases (MNKs) by novel retinamides inhibits growth of human prostate cancer cell lines.Oncotarget. 2015 Feb 20;6(5):3195-210. doi: 10.18632/oncotarget.3084. Oncotarget. 2015. PMID: 25605250 Free PMC article.
References
-
- Jemal A, Siegel R, Ward E, Murray T, Xu J, et al. Cancer statistics, 2007. CA Cancer J Clin. 2007;57:43–66. - PubMed
-
- Huggins C, Hodges CV. Studies on prostatic cancer: I. the effect of castration, of estrogen and of androgen injection on serum phosphatases in metastatic carcinoma of the prostate. 1941. Cancer Research. 1941:293–297. - PubMed
-
- Papsidero LD, Wang MC, Valenzuela LA, Murphy GP, Chu TM. A prostate antigen in sera of prostatic cancer patients. Cancer Res. 1980;40:2428–2432. - PubMed
-
- Kuriyama M, Wang MC, Lee CL, Killian CS, Papsidero LD, et al. Multiple marker evaluation in human prostate cancer with the use of tissue-specific antigens. J Natl Cancer Inst. 1982;68:99–105. - PubMed
-
- Sadar MD, Hussain M, Bruchovsky N. Prostate cancer: molecular biology of early progression to androgen independence. Endocr Relat Cancer. 1999;6:487–502. - PubMed
Publication types
MeSH terms
Substances
LinkOut - more resources
Full Text Sources
Other Literature Sources
Medical
Research Materials
