Processivity and coupling in messenger RNA transcription
- PMID: 20126621
- PMCID: PMC2812496
- DOI: 10.1371/journal.pone.0008845
Processivity and coupling in messenger RNA transcription
Abstract
Background: The complexity of messenger RNA processing is now being uncovered by experimental techniques that are capable of detecting individual copies of mRNA in cells, and by quantitative real-time observations that reveal the kinetics. This processing is commonly modelled by permitting mRNA to be transcribed only when the promoter is in the on state. In this simple on/off model, the many processes involved in active transcription are represented by a single reaction. These processes include elongation, which has a minimum time for completion and processing that is not captured in the model.
Methodology: In this paper, we explore the impact on the mRNA distribution of representing the elongation process in more detail. Consideration of the mechanisms of elongation leads to two alternative models of the coupling between the elongating polymerase and the state of the promoter: Processivity allows polymerases to complete elongation irrespective of the promoter state, whereas coupling requires the promoter to be active to produce a full-length transcript. We demonstrate that these alternatives have a significant impact on the predicted distributions. Models are simulated by the Gillespie algorithm, and the third and fourth moments of the resulting distribution are computed in order to characterise the length of the tail, and sharpness of the peak. By this methodology, we show that the moments provide a concise summary of the distribution, showing statistically-significant differences across much of the feasible parameter range.
Conclusions: We conclude that processivity is not fully consistent with the on/off model unless the probability of successfully completing elongation is low--as has been observed. The results also suggest that some form of coupling between the promoter and a rate-limiting step in transcription may explain the cell's inability to maintain high mRNA levels at low noise--a prediction of the on/off model that has no supporting evidence.
Conflict of interest statement
Figures


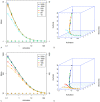
 : C. mean and variance; D. skewness and kurtosis. Points are average values from 10 repetitions for a given activation
  rate, and are colour coded according to
  . In A. and C., a log 10 scale is used on both axes, and error bars show the standard deviation for 10 repetitions. Solid lines in A. and C. are the theoretical solutions for mean and variance are derived from equations 5 and 6. Solid lines in B. and D. are computed from equation 1 in (Supplementary Material).
 , and B.
  . Points are values from a single survey of 66 parameter value combinations (55 in the case
  ), ensuring that each of the standard distributions is fitted to the same simulated distribution and so the KL values are directly comparable.

 ; B.
; B.  . For the on/off-CE model: C.
  ; D.
; D.  . Points are average values from 10 repetitions. Error bars show the standard deviation for 10 repetitions. Solid lines are the theoretical solutions for mean and variance.
 in A and B. Skewness and kurtosis for the on/off-CE model for C:
  ; and D.
  . Points are average values from 10 repetitions. Error bars, where shown, indicate the standard deviation for 10 repetitions. Solid lines join points in the same series.

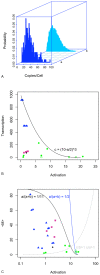
 and
and  parameters from published models: blue triangles indicate mammalian data , green circles indicate yeast , as do purple squares (this paper), and the black diamond shows data from E. coli
. Closed symbols are plotted when
  , open symbols indicate
  . All parameters have been scaled such that
  as in preceding figures. The line is an empirically-derived equation for the upper limit of
  . C. Scatterplot of
  values and
  parameters from published models, symbols are defined as in B. Blue and black lines are the predicted upper constraint on
  for alternative assumptions about the proportion of time in the on state. The grey line is
  .
.References
-
- Becskei A, Kaufmann B, van Oudenaarden A. Contributions of low molecule number and chromosomal positioning to stochastic gene expression. Nat Genet. 2005;37:937–944. - PubMed
-
- Golding I, Paulsson J, Zawilski S, Cox EC. Real-time kinetics of gene activity in individual bacteria. Cell. 2005;123:1025–1036. - PubMed
MeSH terms
Substances
Grants and funding
LinkOut - more resources
Full Text Sources

