

The genome sequence of the rumen methanogen Methanobrevibacter ruminantium reveals new possibilities for controlling ruminant methane emissions
- PMID: 20126622
- PMCID: PMC2812497
- DOI: 10.1371/journal.pone.0008926
The genome sequence of the rumen methanogen Methanobrevibacter ruminantium reveals new possibilities for controlling ruminant methane emissions
Abstract
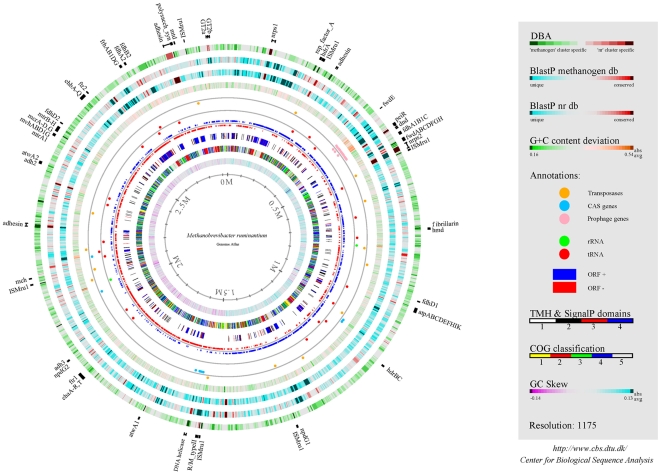
Background: Methane (CH(4)) is a potent greenhouse gas (GHG), having a global warming potential 21 times that of carbon dioxide (CO(2)). Methane emissions from agriculture represent around 40% of the emissions produced by human-related activities, the single largest source being enteric fermentation, mainly in ruminant livestock. Technologies to reduce these emissions are lacking. Ruminant methane is formed by the action of methanogenic archaea typified by Methanobrevibacter ruminantium, which is present in ruminants fed a wide variety of diets worldwide. To gain more insight into the lifestyle of a rumen methanogen, and to identify genes and proteins that can be targeted to reduce methane production, we have sequenced the 2.93 Mb genome of M. ruminantium M1, the first rumen methanogen genome to be completed.
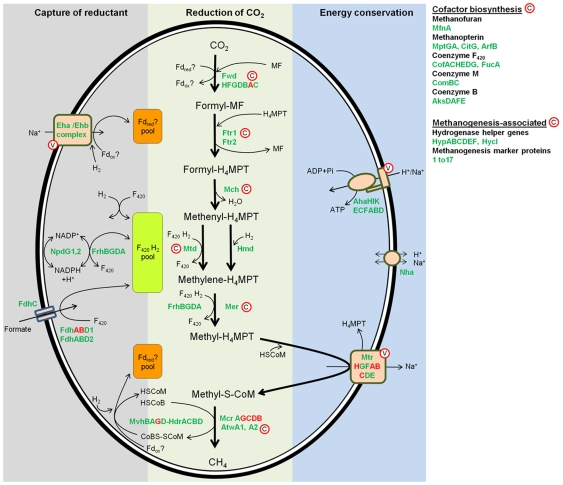
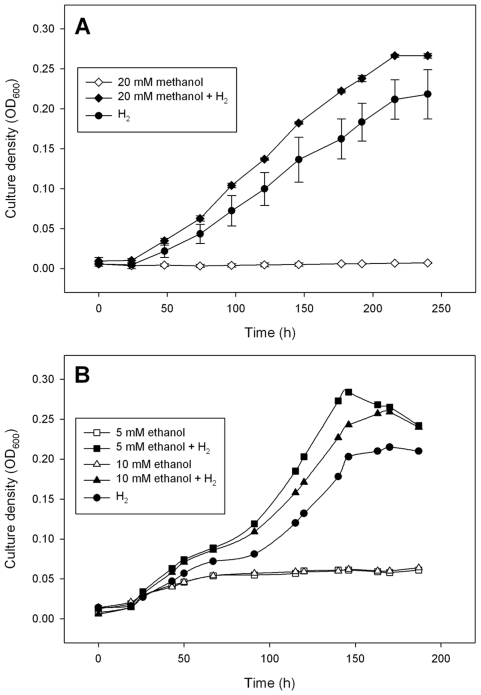
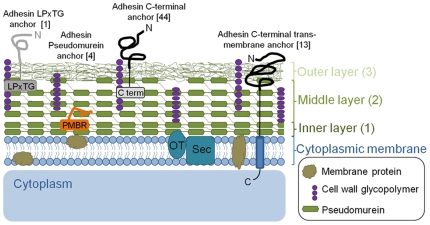
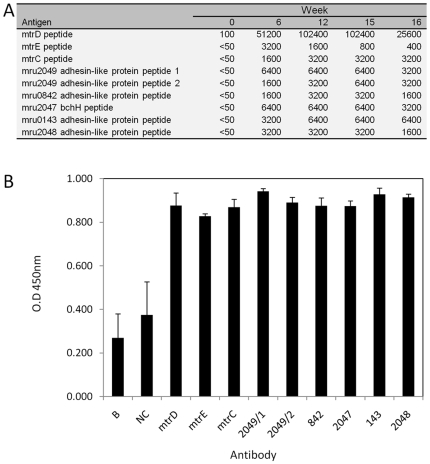
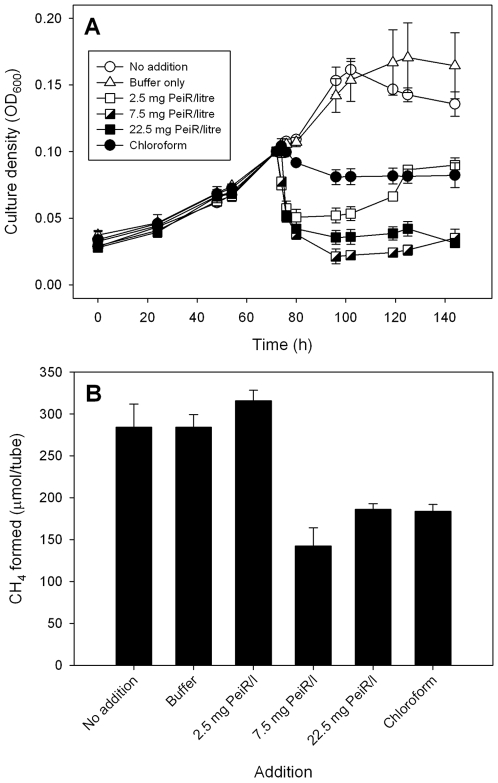
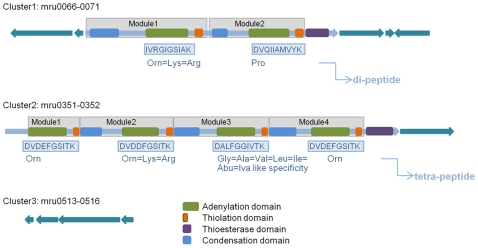
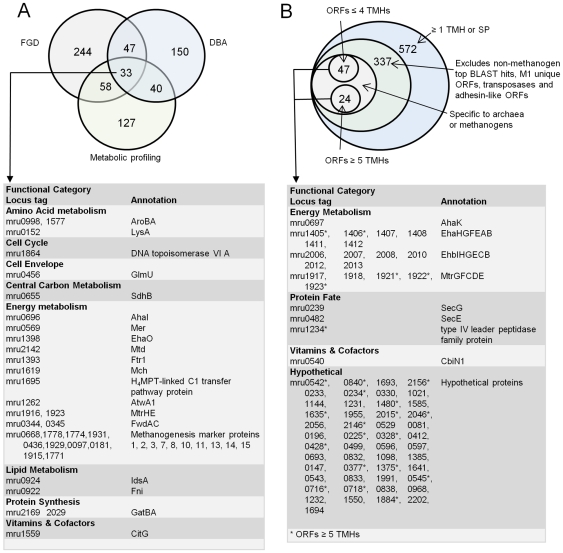
Methodology/principal findings: The M1 genome was sequenced, annotated and subjected to comparative genomic and metabolic pathway analyses. Conserved and methanogen-specific gene sets suitable as targets for vaccine development or chemogenomic-based inhibition of rumen methanogens were identified. The feasibility of using a synthetic peptide-directed vaccinology approach to target epitopes of methanogen surface proteins was demonstrated. A prophage genome was described and its lytic enzyme, endoisopeptidase PeiR, was shown to lyse M1 cells in pure culture. A predicted stimulation of M1 growth by alcohols was demonstrated and microarray analyses indicated up-regulation of methanogenesis genes during co-culture with a hydrogen (H(2)) producing rumen bacterium. We also report the discovery of non-ribosomal peptide synthetases in M. ruminantium M1, the first reported in archaeal species.
Conclusions/significance: The M1 genome sequence provides new insights into the lifestyle and cellular processes of this important rumen methanogen. It also defines vaccine and chemogenomic targets for broad inhibition of rumen methanogens and represents a significant contribution to worldwide efforts to mitigate ruminant methane emissions and reduce production of anthropogenic greenhouse gases.
Conflict of interest statement
Figures
Similar articles
-
Development of Multiwell-Plate Methods Using Pure Cultures of Methanogens To Identify New Inhibitors for Suppressing Ruminant Methane Emissions.Appl Environ Microbiol. 2017 Jul 17;83(15):e00396-17. doi: 10.1128/AEM.00396-17. Print 2017 Aug 1. Appl Environ Microbiol. 2017. PMID: 28526787 Free PMC article.
-
An adhesin from hydrogen-utilizing rumen methanogen Methanobrevibacter ruminantium M1 binds a broad range of hydrogen-producing microorganisms.Environ Microbiol. 2016 Sep;18(9):3010-21. doi: 10.1111/1462-2920.13155. Epub 2016 Jan 18. Environ Microbiol. 2016. PMID: 26643468
-
Rumen methanogen and protozoal communities of Tibetan sheep and Gansu Alpine Finewool sheep grazing on the Qinghai-Tibetan Plateau, China.BMC Microbiol. 2018 Dec 13;18(1):212. doi: 10.1186/s12866-018-1351-0. BMC Microbiol. 2018. PMID: 30545295 Free PMC article.
-
Strategies to Mitigate Enteric Methane Emissions from Ruminant Animals.J Microbiol Biotechnol. 2022 Mar 28;32(3):269-277. doi: 10.4014/jmb.2202.02019. J Microbiol Biotechnol. 2022. PMID: 35283433 Free PMC article. Review.
-
Review: Methanogens and methane production in the digestive systems of nonruminant farm animals.Animal. 2021 Jan;15(1):100060. doi: 10.1016/j.animal.2020.100060. Epub 2020 Dec 10. Animal. 2021. PMID: 33516013 Review.
Cited by
-
Tracing lifestyle adaptation in prokaryotic genomes.Front Microbiol. 2012 Feb 21;3:48. doi: 10.3389/fmicb.2012.00048. eCollection 2012. Front Microbiol. 2012. PMID: 22363326 Free PMC article.
-
The complete genome sequence of the rumen methanogen Methanobacterium formicicum BRM9.Stand Genomic Sci. 2014 Dec 8;9:15. doi: 10.1186/1944-3277-9-15. eCollection 2014. Stand Genomic Sci. 2014. PMID: 25780506 Free PMC article.
-
Enteric methane research and mitigation strategies for pastoral-based beef cattle production systems.Front Vet Sci. 2022 Dec 23;9:958340. doi: 10.3389/fvets.2022.958340. eCollection 2022. Front Vet Sci. 2022. PMID: 36619952 Free PMC article. Review.
-
The glycobiome of the rumen bacterium Butyrivibrio proteoclasticus B316(T) highlights adaptation to a polysaccharide-rich environment.PLoS One. 2010 Aug 3;5(8):e11942. doi: 10.1371/journal.pone.0011942. PLoS One. 2010. PMID: 20689770 Free PMC article.
-
Tailored Nanoparticles With the Potential to Reduce Ruminant Methane Emissions.Front Microbiol. 2022 Mar 11;13:816695. doi: 10.3389/fmicb.2022.816695. eCollection 2022. Front Microbiol. 2022. PMID: 35359731 Free PMC article.
References
-
- IPCC (Intergovernmental Panel on Climate change) Climate Change 2007: The Physical Science Basis, Contribution of Working Group I to the Fourth Assessment Report of the Intergovernmental Panel on Climate Change. 2007. Available: http://www.ipcc.ch/publications_and_data/publications_ipcc_fourth_assess.... Accessed 2009 Sept 30.
-
- Scheehle EA, Kruger D. Global anthropogenic methane and nitrous oxide emissions. The Energy Journal, Special Issue. 2006;3:33–44.
-
- Steinfeld H, Gerber P, Wassenaar T, Castel V, Rosales M, et al. Livestock's Long Shadow: Environmental Issues and Options. Rome: Food and Agriculture Organization of the United Nations. 2006. Available: http://www.fao.org/docrep/010/a0701e/a0701e00.HTM. Accessed 2009 Sept 30.
-
- Food and Agriculture Organization of the United Nations (FAO) The State of Food Insecurity in the World. 2008. Available: http://www.fao.org/docrep/011/i0291e/i0291e00.htm. Accessed 2009 Sept 30.
-
- United Nations. Kyoto Protocol to the United Nations Framework Convention on Climate Change. UNEP.IUC/99/10. Chatlelaine, Switzerland, United Nations Environment Programme's Information Unit for Conventions, for the Climate Change Secretariat. 1997. Available: http://unfccc.int/resource/docs/convkp/kpeng.pdf. Accessed 2009 Sept 30.
Publication types
MeSH terms
Substances
LinkOut - more resources
Full Text Sources
Other Literature Sources
Molecular Biology Databases
Miscellaneous
