

doi: 10.1039/b917150a.
Epub 2009 Dec 3.
Electrochemical sensing in paper-based microfluidic devices
Affiliations
- PMID: 20126688
- PMCID: PMC3065124
- DOI: 10.1039/b917150a
Item in Clipboard
Electrochemical sensing in paper-based microfluidic devices
Lab Chip.
.
Abstract
This paper describes the fabrication and the performance of microfluidic paper-based electrochemical sensing devices (we call the microfluidic paper-based electrochemical devices, microPEDs). The microPEDs comprise paper-based microfluidic channels patterned by photolithography or wax printing, and electrodes screen-printed from conducting inks (e.g., carbon or Ag/AgCl). We demonstrated that the microPEDs are capable of quantifying the concentrations of various analytes (e.g., heavy-metal ions and glucose) in aqueous solutions. This low-cost analytical device should be useful for applications in public health, environmental monitoring, and the developing world.
Figures
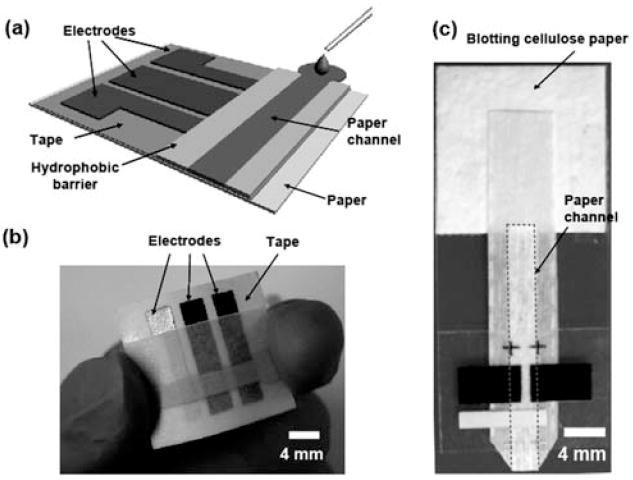
(a) Schematic of a paper-based electrochemical sensing device. The sensor comprises three electrodes printed on a piece of paper substrate (or plastic) and a paper channel. The paper channel was in conformal contact with the electrodes, and was held in place by double-sided adhesive tape surrounding the electrodes. A photograph of a paper-based electrochemical sensing device for the analysis of glucose (b), and a hydrodynamic paper-based electrochemical sensing device for the measurement of heavy-metal ions (c). The device consists of two printed carbon electrodes as the working and counter electrodes, and a printed Ag/AgCl electrode as the pseudo-reference electrode. The paper channel was fabricated by patterning SU-8 as a hydrophobic barrier for aqueous solution. The paper channel in (b) was colored with red ink to enhance imaging. The dashed line in (c) indicates the edge of the paper channel. The scale bar is 4 mm.
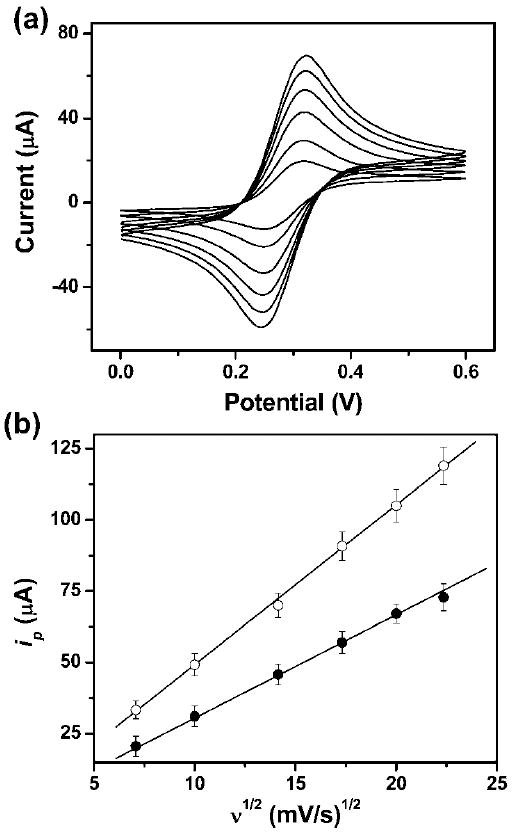
(a) Cyclic voltammograms of 2.0 mM ferrocene carboxylic acid in 0.5 M KCl aqueous solution (pH = 7.0) in a μPED at various scan rates (ascending along y-axis): 50, 100, 200, 300, 400, and 500 mV s−1. We used a 4 mm by 4 mm carbon-printed electrode as the working electrode, and a printed Ag/AgCl electrode as the reference electrode. (b) The plot of anodic peak current vs. the square root of the scan rate (ν1/2) for CV experiments conducted on a paper device (●) and in a bulk solution (○). The solid lines represent a linear fit to (●) with regression equation: y = −3.6 + 3.5x (R2 = 0.998, n = 8), and a linear fit to (○) with regression equation: y = −7.1 + 5.6x (R2 = 0.999, n = 8).
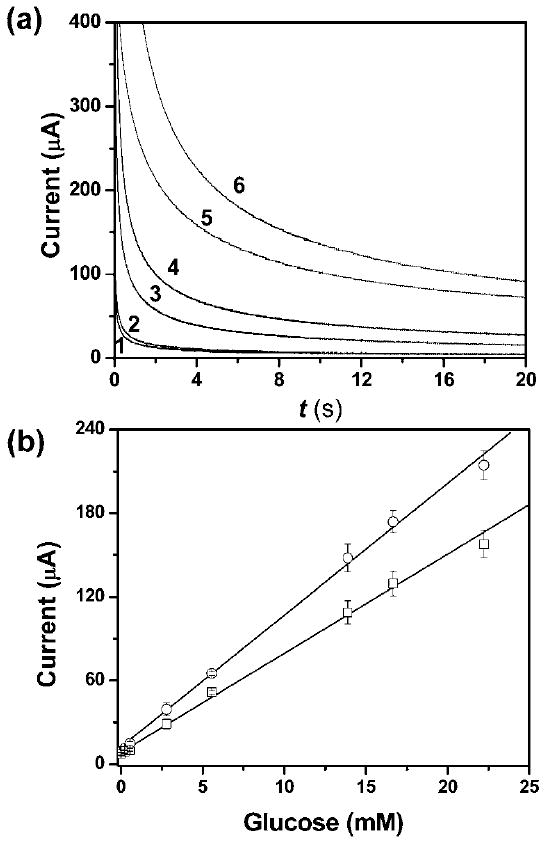
(a) Representative chronoamperometric curves for glucose concentrations (mM): 0 (1), 0.2 (2), 2.8 (3), 5.6 (4), 13.9 (5) and 22.2 (6) in the μPEDs. (b) Calibration plots of current as a function of the concentration of glucose for the detection of glucose in the μPEDs (□) and in bulk solutions (○). We used three carbon electrodes as working, counter, and pseudo-reference electrodes, respectively. The working electrodes had a surface area of 16 mm2 in contact with the solution in both the μPEDs and the bulk solutions. The distance between electrodes was 1.0 mm. A 500 mV step potential (vs. a carbon pseudo-reference electrode) was used to generate the calibration curve. The solid line represents a linear fit to (□) with regression equation: y = 9.5 + 6.9x (R2 = 0.995, n = 8), and a linear fit to (○) with regression equation: y = 12.1 + 9.4x (R2 = 0.997, n = 8).
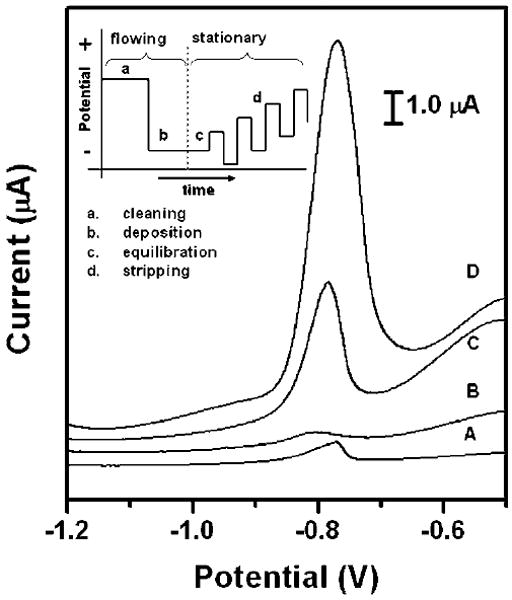
Square-wave anodic stripping voltammograms for 25 ppb solution of Pb(ii ) in 0.1 M acetate buffer (pH 4.5) in the presence of 25 ppb Zn(ii ) : (A) a 100 μL solution placed directly on the electrodes; (B) a 100 μL solution added to the stagnant μPEDs (without a pad of blotting paper as sink); (C and D) a solution of analytes continuously wicking the paper channel of the hydrodynamic μPEDs. The deposition time was 120 s (A, B, C) or 360 s (D). The SWASV was performed in the potential range of −1.2 to −0.5 V under optimized conditions: frequency, 20 Hz; amplitude, 25 mV; potential increment, 5 mV; equilibration time, 30 s. Deposition was performed at −1.2 V; ‘cleaning’ was performed at +0.5 V for 60 s. A bismuth(iii ) concentration of 500 μg L−1 was chosen for the co-deposition of heavy-metal ions. We used screen-printed carbon electrodes as the working and counter electrodes, and a screen-printed Ag/AgCl electrode as the reference electrode. Inset shows the schematic of the four steps of the square-wave anodic stripping voltammetry.
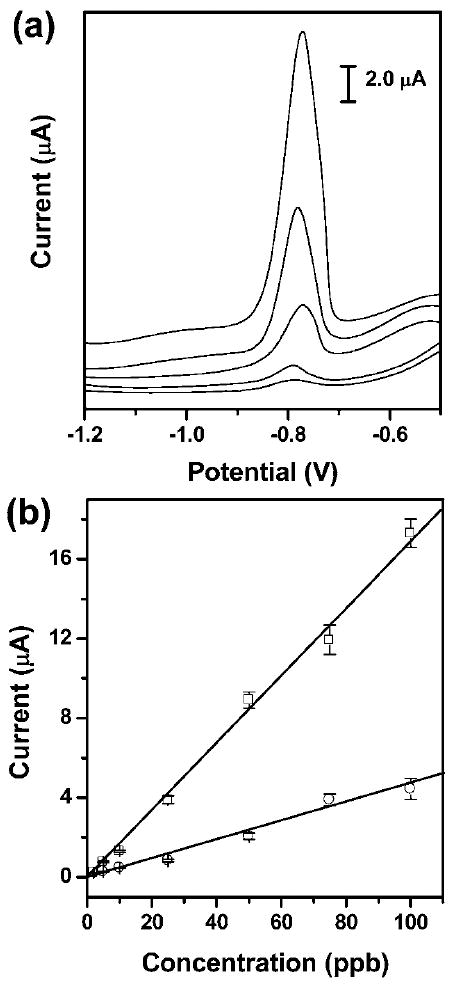
(a) Square-wave anodic stripping voltammograms for the analysis of trace Pb(ii ) in 0.1 M acetate buffer (pH 4.5) in the presence of Zn(ii ) (1: 1 molar ratio of Pb(ii ) to Zn(ii )) in the μPEDs with a solution of analytes continuously wicking along the paper channel. The concentrations (ppb) of Pb(ii ) (ascending along the y-axis) are 5, 10, 25, 50, and 100. The data are unsmoothed. (b) The resulting calibration plots for the analysis of trace Pb(ii ): a 100 μL solution of analytes placed on the electrodes (○), and a solution of analytes continuously wicking along the paper channel in the μPEDs (□). Square-wave voltammetric stripping was performed in the potential range of −1.2 to −0.5 V under optimized conditions: frequency, 20 Hz; amplitude, 25 mV; potential increment, 5 mV; equilibration time, 30 s. Deposition was performed at −1.2 V for 120 s; ‘cleaning’ was performed at +0.5 V for 60 s. A bismuth(iii ) concentration of 500 μg L−1 was chosen for the co-deposition of heavy-metal ions. We used screen-printed carbon electrodes as working and counter electrodes, and a screen-printed Ag/AgCl electrode as the reference. The solid lines represent a linear fit to (○) with regression equation: y = −0.08 + 0.05x (R2 = 0.978, n = 8), and a linear fit to (□) with regression equation: y = −0.21 + 0.17x (R2 = 0.996, n = 8).
References
-
- Dungchai W, Chailapakul O, Henry CS. Anal Chem. 2009;81:5821–5826. - PubMed
-
- Hones J, Muller P, Surridge N. Diabetes Technol Ther. 2008;10:S10–S26.
-
- World Health Organization. Guidelines for Drinking-Water Quality. WHO, WHO Press; Switzerland: 2006.
Publication types
MeSH terms
Substances
Grants and funding
LinkOut - more resources
Full Text Sources
Other Literature Sources
Miscellaneous