. 2010 Feb 21;10(4):505-11.
doi: 10.1039/b916199f. Epub 2009 Dec 8.

Microfluidic isolation and transcriptome analysis of serum microvesicles

Affiliations

Microfluidic isolation and transcriptome analysis of serum microvesicles

Chihchen Chen et al. Lab Chip. .

Abstract

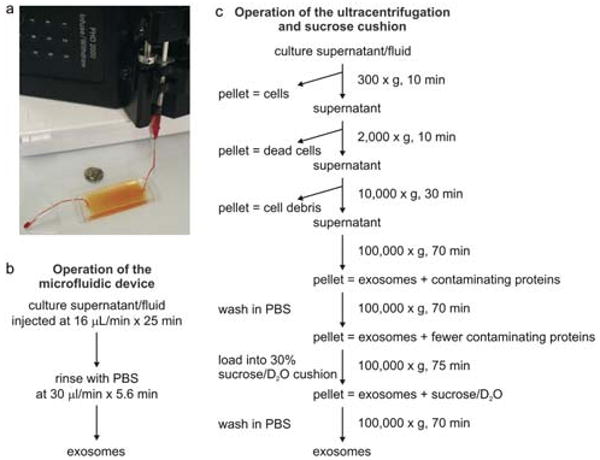
Microvesicles (exosomes) shed from both normal and cancerous cells may serve as means of intercellular communication. These microvesicles carry proteins, lipids and nucleic acids derived from the host cell. Their isolation and analysis from blood samples have the potential to provide information about state and progression of malignancy and should prove of great clinical importance as biomarkers for a variety of disease states. However, current protocols for isolation of microvesicles from blood require high-speed centrifugation and filtration, which are cumbersome and time consuming. In order to take full advantage of the potential of microvesicles as biomarkers for clinical applications, faster and simpler methods of isolation will be needed. In this paper, we present an easy and rapid microfluidic immunoaffinity method to isolate microvesicles from small volumes of both serum from blood samples and conditioned medium from cells in culture. RNA of high quality can be extracted from these microvesicles providing a source of information about the genetic status of tumors to serve as biomarkers for diagnosis and prognosis of cancer.


Figures

Fig. 1
Fig. 1
Experimental setup of microfluidic devices and ultracentrifugation procedures. (a) Image of a device with a syringe pump. (b) The operation procedure of the microfluidic device for isolation of microvesicles. (c) Flow chart for a typical microvesicle purification procedure based on differential ultracentrifugation and sucrose cushion (adapted from ref. 18).
Fig. 2
Fig. 2
Scanning EM images of microvesicles captured in microchannels. (a) Scanning EM image showing the microvesicles prepared from classical sequential centrifugations of cell culture supernatant bound to the microchannel surface. (b) Scanning EM image showing the microvesicles bound to the microchannel surface after 10 μL of GBM patient serum was passed through the microchannel. Higher magnification images of (b) are shown in (c) and (d). The distributions of both the projected area diameters and the Feret's diameters of microvesicles in images (a) and (c) are shown in (e) and (f), respectively. Projected area diameters were calculated from the projected area assuming circular geometry while Feret's diameters were determined as the greatest distance possible between any two points along the boundary of a region of interest.
Fig. 3
Fig. 3
Microfluidically captured microvesicles contain RNA. Bioanalyzer data showing the intensities and size distributions of fluorescently labeled total RNA extracted from microvesicles captured on anti-CD63 or IgG antibody-coated microchannels injected with 100 μL of GMB patient serum (a) and 400 μL normal control serum (b), respectively. The lowest migrating peak at 25 nt represents an internal standard. The x-axis indicates the length of the RNA in nucleotides (nt) while the y-axis indicates fluorescence intensity in arbitrary units. Note that the two ribosomal RNA peaks (18S and 28S) from cellular RNA profile were absent in both (a) and (b).
Fig. 4
Fig. 4
RT-PCR performed on RNA extracted from microfluidically isolated microvesicles. Agarose gels showing RT-PCR products performed on RNA extracted from microvesicles captured from both GBM patient and normal control sera on anti-CD63 or control IgG-coated microchannels. The RT-PCR product of GAPDH mRNA appears as a band at 106 bp, while the nested RT-PCR product of wild-type IDH-1 mRNA appears as a band at 100 bp.

Similar articles

Cited by

References

    1. Andre F, Schartz NEC, Movassagh M, Flament C, Pautier P, Morice P, Pomel C, Lhomme C, Escudier B, Le Chevalier T, Tursz T, Amigorena S, Raposo G, Angevin E, Zitvogel L. Lancet. 2002;360:295–305. - PubMed
    1. Thery C, Zitvogel L, Amigorena S. Nat Rev Immunol. 2002;2:569–579. - PubMed
    1. Booth AM, Fang Y, Fallon JK, Yang JM, Hildreth JEK, Gould SJ. J Cell Biol. 2006;172:923–935. - PMC - PubMed
    1. Pan BT, Johnstone RM. Cell. 1983;33:967–977. - PubMed
    1. Fevrier B, Raposo G. Curr Opin Cell Biol. 2004;16:415–421. - PubMed

Publication types