. 2010 Mar;10(6):1316-27.
doi: 10.1002/pmic.200900412.

Pathway analysis of dilated cardiomyopathy using global proteomic profiling and enrichment maps

Affiliations
Free PMC article

Pathway analysis of dilated cardiomyopathy using global proteomic profiling and enrichment maps

Ruth Isserlin et al. Proteomics. 2010 Mar.
Free PMC article

Abstract

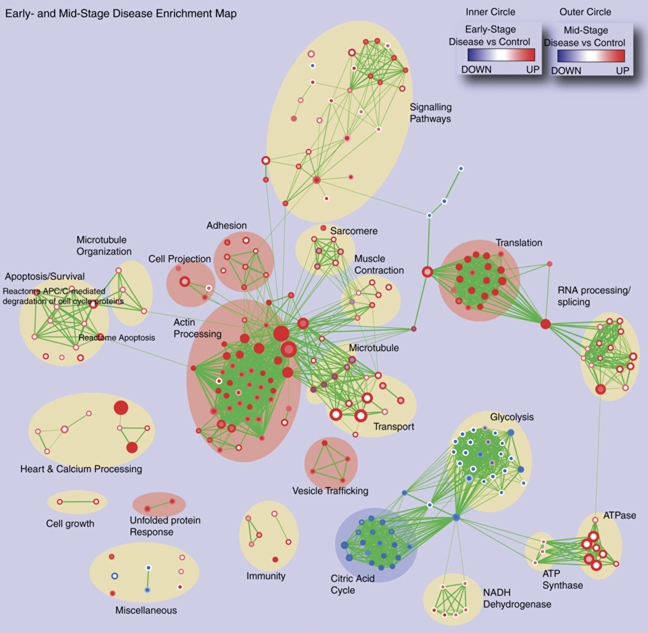
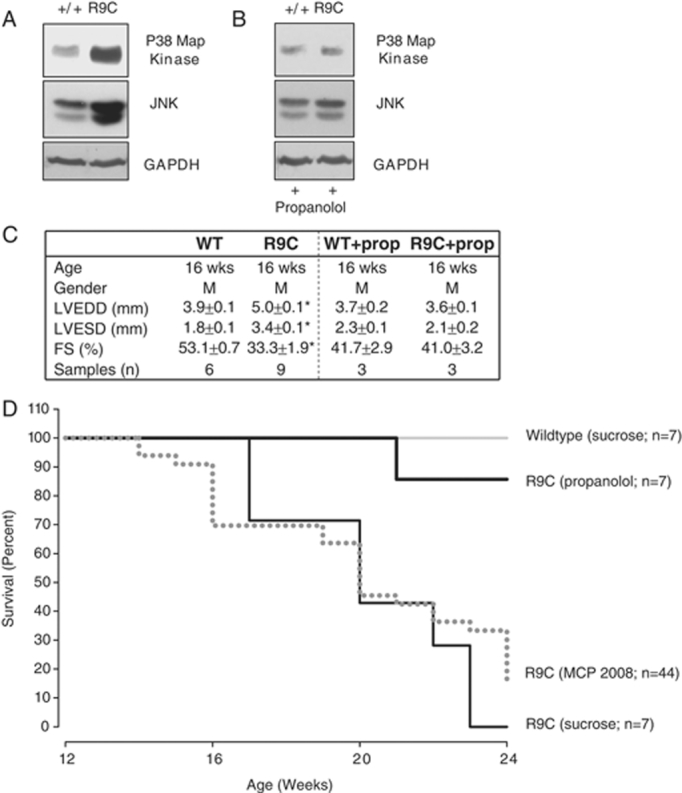
Global protein expression profiling can potentially uncover perturbations associated with common forms of heart disease. We have used shotgun MS/MS to monitor the state of biological systems in cardiac tissue correlating with disease onset, cardiac insufficiency and progression to heart failure in a time-course mouse model of dilated cardiomyopathy. However, interpreting the functional significance of the hundreds of differentially expressed proteins has been challenging. Here, we utilize improved enrichment statistical methods and an extensive collection of functionally related gene sets, gaining a more comprehensive understanding of the progressive alterations associated with functional decline in dilated cardiomyopathy. We visualize the enrichment results as an Enrichment Map, where significant gene sets are grouped based on annotation similarity. This approach vastly simplifies the interpretation of the large number of enriched gene sets found. For pathways of specific interest, such as Apoptosis and the MAPK (mitogen-activated protein kinase) cascade, we performed a more detailed analysis of the underlying signaling network, including experimental validation of expression patterns.


Figures

Figure 1
Figure 1
Enrichment analysis workflow. Outline of the processing of information from MS/MS data to Enrichment Map. First, spectral counts measured for each identified protein at two time points (early and mid-stage) in the PLN-R9C cardiovascular disease model and the healthy (wild-type) control were normalized and ranked by p-value. The ranked protein list was then examined for significant over-representation of gene sets using the threshold-free technique of Gene Set Enrichment Analysis (GSEA). Gene sets were collected from a diverse set of public databases. Finally, the enrichment results were visualized to enable easy manual detection of global trends and hypothesis generation. A node in the Enrichment Map represents a gene set. Node color intensity represents the enrichment significance and the hue (blue/red) indicates whether a particular gene set is up- or down-regulated. Node size represents the gene set size and line thickness shows the degree of overlap (shared genes) between the two gene sets it connects. Two different enrichment experiments were simultaneously visualized to compare the enrichment results of the early- and mid-disease stages by mapping early-stage results to the node center (inner part) and mid-stage results to the node border (outer part).
Figure 2
Figure 2
Processes perturbed in early- versus mid-stage DCM. Enrichment Map representation of the GSEA results obtained for the PLN-R9C transgenic mouse model of DCM versus wild type littermate controls at an early stage (8 wk, pre-symptomatic) and mid-stage (16 wk, reduced cardiac function but minimal morbidity) of heart disease. The inner circle is colored according to early stage onset, and the outer circle according to mid-stage disease. Node color and shading intensity represents the statistical significance of enrichment of a particular gene set.
Figure 3
Figure 3
Activation of apoptotic signaling via caspase 3 and gelsolin. Consecutive zoom-ins of the Enrichment Map gene set cluster representing terms related to cellular apoptosis. Individual protein nodes represented in the pathway network are shown for the caspase neighborhood. Proteins are colored according to the expression ratio of condition versus control at the early (inner circle) and mid-stages (outer circle) of disease.
Figure 4
Figure 4
Signaling cluster and integrin signaling. Zoom-in of the Enrichment Map gene set cluster representing signaling pathways enriched at the early and mid-stages of heart failure. A summary description of the cluster was visualized as a “term cloud” using Wordle (http://www.wordle.net/) derived from the text descriptions of all gene sets. Term size indicates its frequency; thus, large terms best summarize the cluster (i.e. signaling pathways). Specific terms related to the integrin pathway are highlighted within this cluster and in the network.
Figure 5
Figure 5
Reduced mortality and decreased MAPK activation with propanolol. (A) Cardiac cellular lysates from 16-wk-old mice were collected and analyzed for MAPK pathway activity (indicated by JNK expression and phosphorylation of p38 Map kinase), and versus a control (GAPDH). MAPK pathway is overactive in PLN-R9C mice. (B) Treating mice with propanolol reduces activity of MAPK pathway at 16 wk in PLN-R9C mice compared to wild type. (C) Sixteen-wk-old mice were subjected to M-mode echocardiography and left ventricular end diastolic dimension (LVEDD), left ventricular end systolic dimension (LVESD) and fractional shortening (FS) were assessed. Propanolol treatment reduces LVEDD, LVESD and fractional shortening to wild type levels. (D) WT and PLN-R9C mice were treated with/without propanolol (0.5 g/L in drinking water) starting at 8 wk of age. Mortality was monitored in all groups at 16 wk. Cardiac lysates and tissues were obtained and analyzed as previously described . Antibodies used: phospho-p38 – BD ♯612281 from BD bioscience and SAPK/JNK – mAb ♯9258 from Cell Signaling.

Similar articles

Cited by

References

    1. Rosamond W, Flegal K, Furie K, Go A, et al. Heart Disease and Stroke Statistics 2008 Update. A Report From the American Heart Association Statistics Committee and Stroke Statistics Subcommittee. Circulation. 2008;117:e25–e146. - PubMed
    1. Malcom J, Arnold O, Howlett JG, Ducharme A, et al. Canadian Cardiovascular Society Consensus Conference guidelines on heart failure – 2008 update: best practices for the transition of care of heart failure patients, and the recognition, investigation and treatment of cardiomyopathies. Can. J. Cardiol. 2008;24:21–40. - PMC - PubMed
    1. Arab S, Gramolini AO, Ping P, Kislinger T, et al. Cardiovascular proteomics: tools to develop novel biomarkers and potential applications. J. Am. Coll. Cardiol. 2006;48:1733–1741. - PubMed
    1. Ouzounian M, Lee DS, Gramolini AO, Emili A, et al. Predict, prevent and personalize: Genomic and proteomic approaches to cardiovascular medicine. Can. J. Cardiol. 2007;23:28A–33A. - PMC - PubMed
    1. Isserlin R, Emili A. Interpretation of large-scale quantitative shotgun proteomic profiles for biomarker discovery. Curr. Opin. Mol. Ther. 2008;10:231–242. - PubMed

Publication types

LinkOut - more resources