. 2010 Apr 1;518(7):1113-32.
doi: 10.1002/cne.22267.

Role of the cytoplasmic domain of the L1 cell adhesion molecule in brain development

Affiliations

Role of the cytoplasmic domain of the L1 cell adhesion molecule in brain development

Yukiko Nakamura et al. J Comp Neurol. .

Abstract

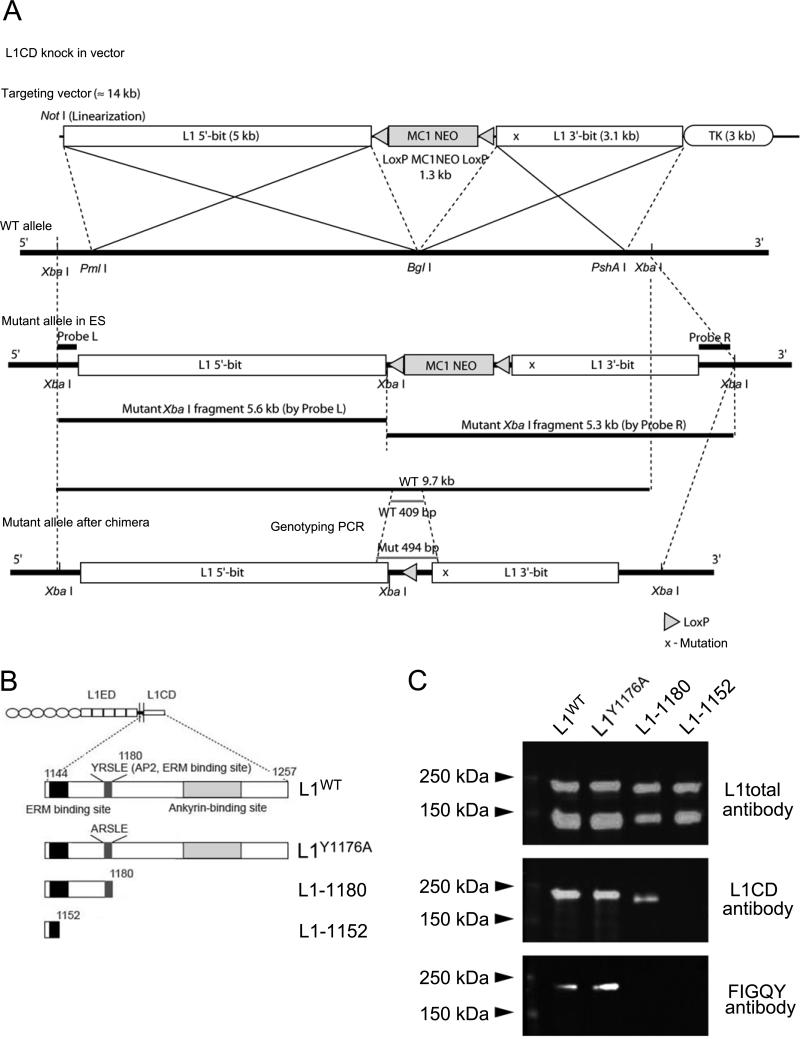
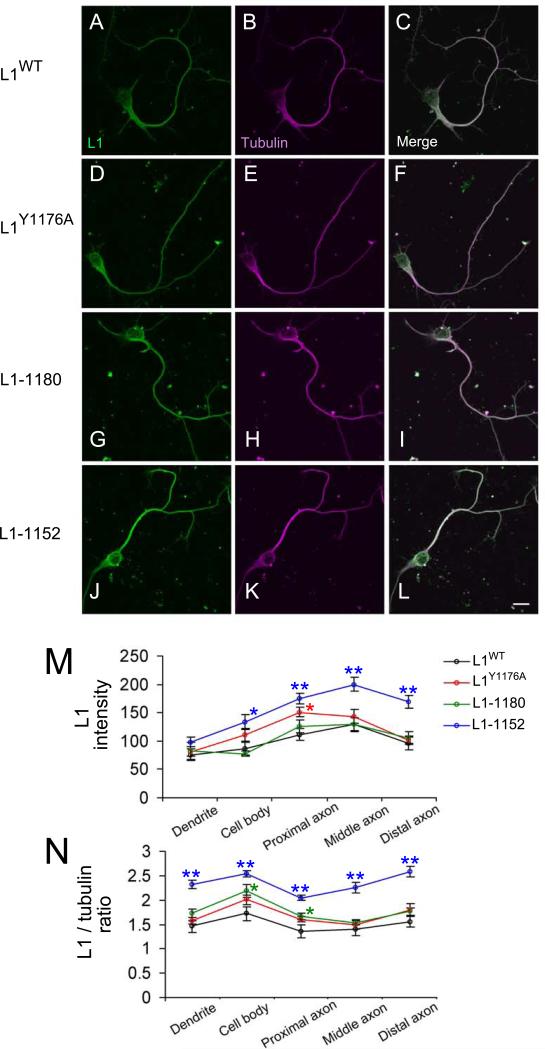
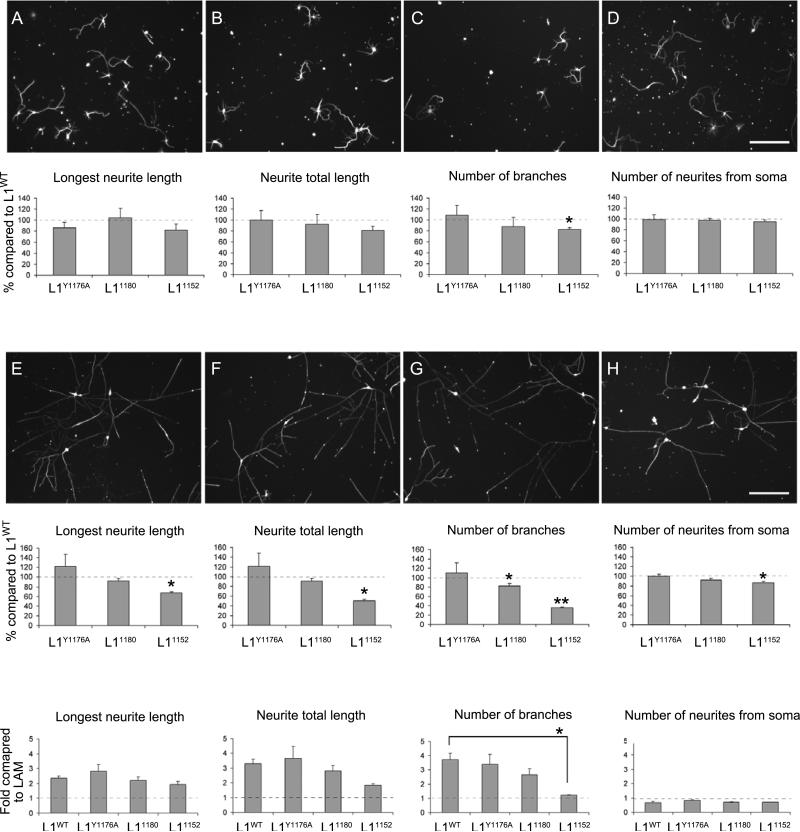
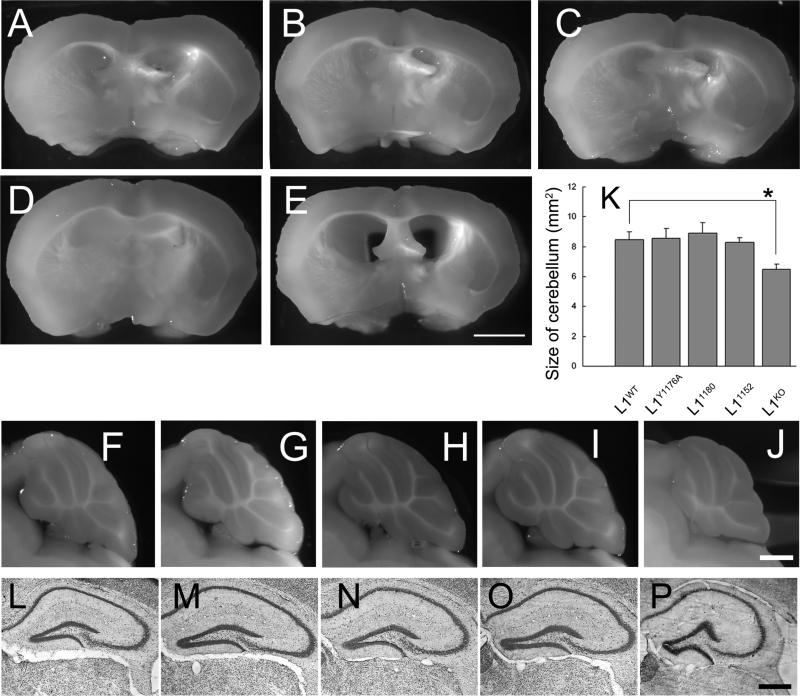
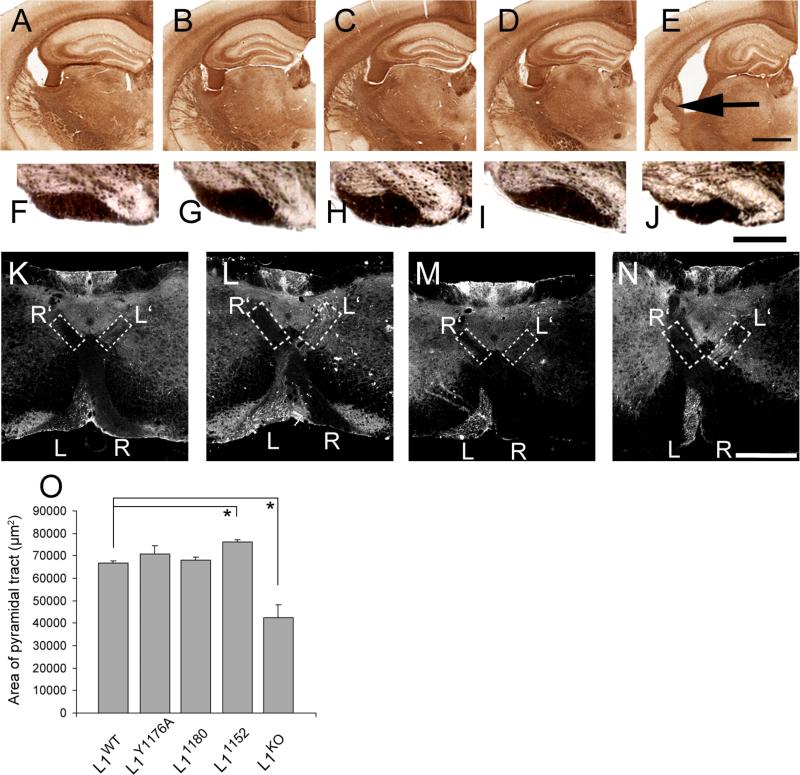
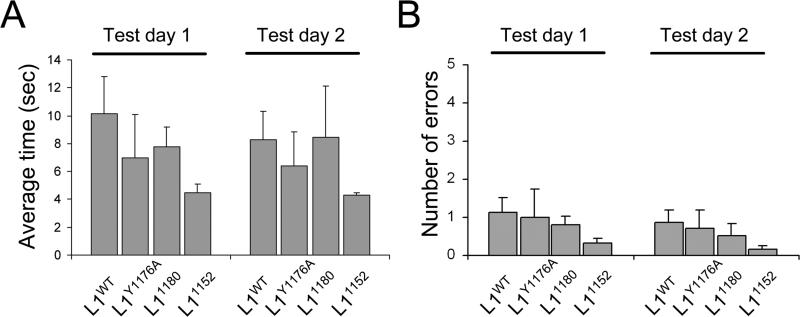
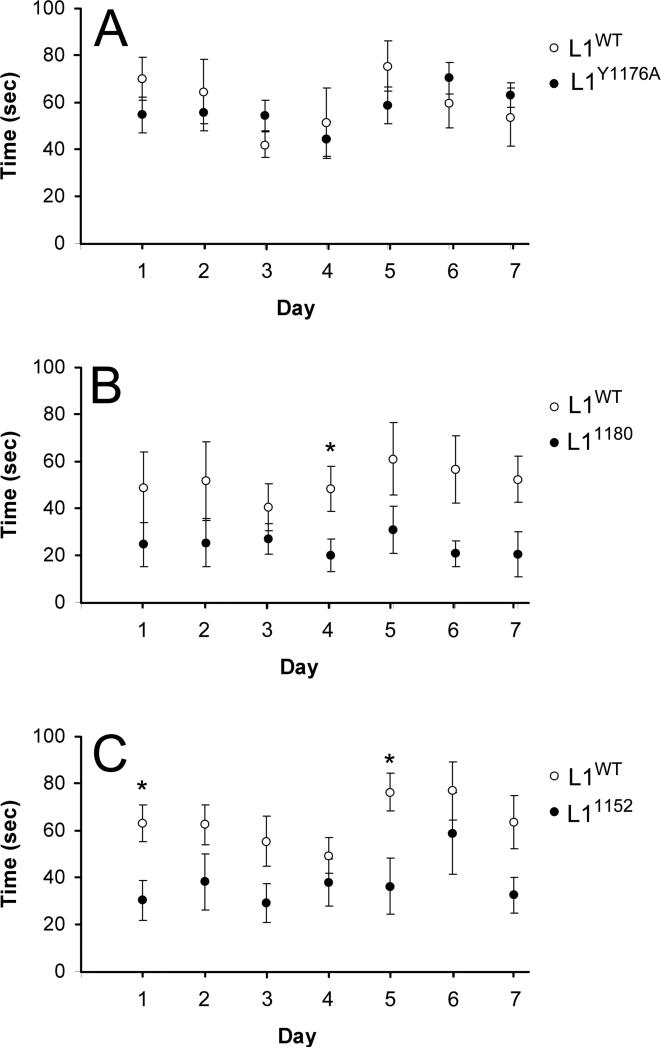
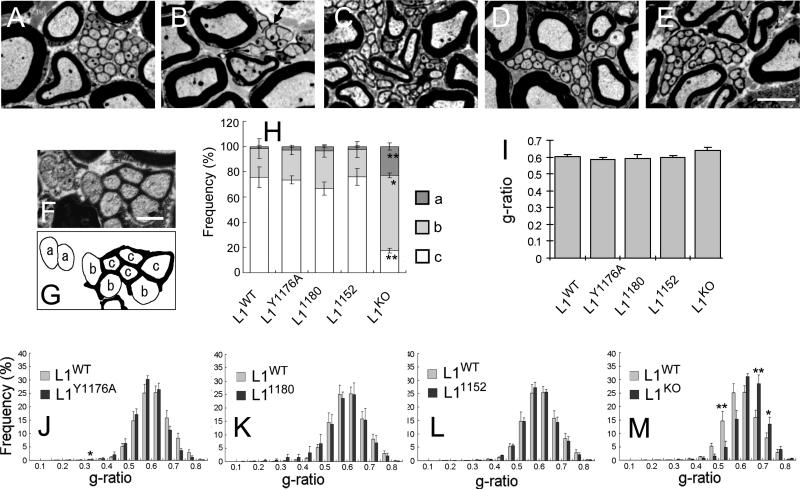
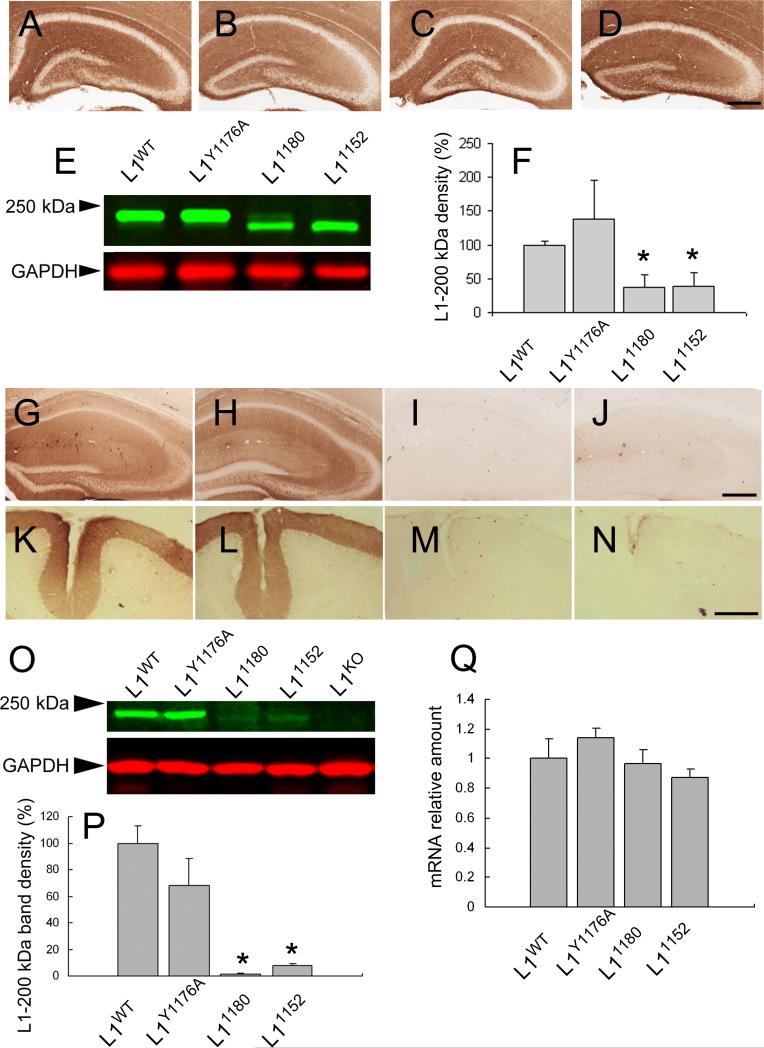
Mutations in the human L1CAM gene cause X-linked hydrocephalus and MASA (Mental retardation, Aphasia, Shuffling gait, Adducted thumbs) syndrome. In vitro studies have shown that the L1 cytoplasmic domain (L1CD) is involved in L1 trafficking, neurite branching, signaling, and interactions with the cytoskeleton. L1cam knockout (L1(KO)) mice have hydrocephalus, a small cerebellum, hyperfasciculation of corticothalamic tracts, and abnormal peripheral nerves. To explore the function of the L1CD, we made three new mice lines in which different parts of the L1CD have been altered. In all mutant lines L1 protein is expressed and transported into the axon. Interestingly, these new L1CD mutant lines display normal brain morphology. However, the expression of L1 protein in the adult is dramatically reduced in the two L1CD mutant lines that lack the ankyrin-binding region and they show defects in motor function. Therefore, the L1CD is not responsible for the major defects observed in L1(KO) mice, yet it is required for continued L1 protein expression and motor function in the adult.


Figures

Figure 1
Figure 1. Production of L1CD mutant mice
(A) Schematic model of the strategy used to mutate the L1cam gene. The bold line indicates the wild type allele, and the corresponding fragment of the targeting vector is depicted in the white box. (X) in “3’-bit” fragment indicates mutated region. A loxP-neomycin cassette was inserted with reverse orientation into the Bgl I site located between exon 26 and exon 27 for positive selection. Probes L and R were prepared for confirmation of 5’ -and 3’ – recombination. Xba I digestion gives a 9.7 kb wild type fragment while the mutant allele gives a 5.6 kb 5’ fragment and a 5.9 kb 3' fragment. Primers for genotyping PCR were designed to amplify a 409 bp wild type fragment and a 494 bp mutant fragment. Cre-recombinase regulated by the protamine promoter is carried by ES cells and removes the loxP-Neo cassette once it is integrated into the chimera sperm (germ line). (B) Schematic representation of L1cam in the L1CD mutant mice. The amino acid numbers correspond to their position in the L1CD of L1WT (aa 1144-1257). The juxtamembrane region, the ERM binding site, ankyrin binding site and AP-2 binding site are highlighted. The numbers of the key residues are indicated on top of the corresponding residue. The L1Y1176A mice have a single amino acid substitution. The L11152 mice have a truncation after the S1152 residue. The L11180 mice have truncation after the E1180 residue. (C) Western blot analysis from whole brain after immunoprecipitation using L1ex antibody. Three different antibodies were used for characterization of L1WT, L1Y1176A, L11180 and L11152 mice. L1total polyclonal antibody recognizes L1 extracellular and intracellular regions, L1CD polyclonal antibody recognizes the cytoplasmic region of L1, and FIGQY monoclonal antibody recognizes the FIGQY region in the ankyrin binding site.
Figure 2
Figure 2. Normal L1 protein expression in hippocampal neurons from L1CD mutant mice
A-L: Hippocampal culture on laminin substrate at 3 days in vitro. These neurons are stained by anti-L1 total antibody (A, D, G, J) and anti-B3 tubulin antibody (B, E, H, K). A-C: WT; D-E: L1Y1176A; G-H: L11180; J-L: L11152. The merged images are shown in C, F, I, L. M shows that the intensity of L1 several regions (dendrite, cell body, proximal axon, middle axon and distal axon). Fifteen neurons each from the L1CD lines and L1WT were analyzed using confocal images. N shows the relative amount of L1 intensity, which is normalized to the tubulin intensity. All L1CD mutant mice could produce and transport L1 protein into axons. *p < 0.05, **p < 0.001. Scale bar = 10 μm.
Figure 3
Figure 3. Neurite branching on L1 substrates is impaired in L11152 mutant mice. A & I: WT; B & J: L1Y1176A; C & K: L11180; D & L: L11152
A-D: Hippocampal neuronal culture grown on laminin substrate at 3 Days In Vitro (DIV). Neurons are stained with anti-tubulin. Total neurite length, longest neurite length, number of neurite branches and the number of neurites extending from soma are quantified. The mean values of neurons of L1CD mutant mice are normalized to mean values of neurons of L1WT mice. *p < 0.05. Scale bar = 100 μm. I-L: Hippocampal neuronal culture grown on L1-Fc substrate at 3 DIV. The number of neurite branches for L11152 mutant mice was significantly lower than L1WT mice. *p < 0.05, **p < 0.001. The mean length or number of neurites on L1-Fc substrate was compared with the laminin substrate. Longest neurite length and neurite total length was increased more than two times, whereas number of branches of L11152 mice did not increase on the laminin substrate compared to L1WT mice. *p < 0.05.
Figure 4
Figure 4. Lack of gross morphological abnormalities in L1CD mutant mice. A, F, L: WT; B, G, M: L1Y1176A; C, H, N: L11180; D. I, O: L11152; E, J, P: L1KO
(A-E) No hydrocephalus in L1CD mutant mice. Coronal section from brains showed that there are no enlarged ventricles in L1CD mice, although L1KO mice have enlarged ventricles. n = 3. Scale bar, 200 μm (F-J) Normal morphology of cerebellar lobe in mid-sagittal sections of brains. The cerebellar lobule shows normal morphology in L1CD mutant mice. n=3. Scale bar, 1 mm. (K) Morphometric analysis of cerebellum at the midline of brains. There is no significant difference in the size of the cerebellum of L1CD mutant mice, although the L1KO mice cerebella are significantly smaller. n = 3. *p < 0.05. (L-P) Cresyl violet staining for hippocampus region. Formation of hippocampus is normal in L1CD mutant mice compared with L1WT mice, although L1KO mice have a smaller hippocampus. Scale bar = 500 μm
Figure 5
Figure 5. Normal axonal guidance in L1CD mutant mice. A, F, K: WT; B, G, L: L1Y1176A; C, H, M: L11180; D. I, N: L11152; E, J: L1KO. A-E: scale bar = 1 mm, F-J: scale bar = 100 μm. L-O: scale bar = 500 μm
(A-E) Neurofilament staining of brain sections. There is no hyperfasciculation of axons in the internal capsule of L1CD mice, although L1KO mice have hyperfasciculated axons (arrowhead). Scale bar, 1 mm. (F-J) Coronal sections in medulla of adult mice. (B-1) The morphology of the pyramidal tract is normal in L1CD mutant mice compared to L1WT mice. Scale bar, 300 μm. (O) The size of the pyramidal tract was not significantly different between all L1CD mutant mice and L1WT mice, although L1KO mice have significantly smaller pyramidal tracts. n = 3. *p < 0.005. (K-N) The pyramidal tract is normal in L1CD mutant mice. BDA was injected into the left side of the motor cortex. At the pyramidal decussation area, the labeled pyramidal tract was observed in the left side of the ventral region (L) and also in the contralateral side of the dorsal region (L’) in all L1CD mice and L1WT mice. In contrast, the dorsal ipsilateral pyramidal tracts are not labeled. Scale bar, 500 μm.
Figure 6
Figure 6. Normal spatial memory in L1CD mutant mice
Radial-arm water maze for spatial memory. (A) The average time for finding the platform and (B) the average number of errors were not significantly different between L1CD mutant mice and L1WT mice. L1WT n = 7, L1Y1176A n = 4, L11180 n = 7, L11152 n = 6
Figure 7
Figure 7
Impaired motor function in L11180 and L11152 mice. The time in balance on the accelerated rotarod was measured using age-matched mice, comparing the L1CD mutant mice and L1WT mice. L11180 (B) and L11152 (C) mutant mice showed a significantly reduced performance compared with L1WT mice but the L1Y1176A (A) did not. L1WT n = 8, L1Y1176A n = 7, L11180 n = 7, L11152 n = 7, *p < 0.05
Figure 8
Figure 8. Normal morphology of unmyelinated and myelinated axons
Electron microscopy of sciatic nerves of 8-week-old mice A: L1WT, B: L1KO, C: L1Y1176A, D: L11180, E: L11152. Schwann cells compactly ensheathe multiple unmyelinated axons in L1WT and in all L1CD mutant mice, although L1KO showed abnormal Remak bundles. Myelin membranes were tightly packed around large axons in L1WT and in all L1CD mutant mice. Scale bar = 3 μm. F-G) Classification scheme of unmyelinated axons depending on the degree of ensheathment. (a) not ensheathed; (b) partially ensheathed; (c) completely ensheathed. H) The percentage of completely ensheathed unmyelinated axons was almost identical between L1CD mutant mice and L1WT mice, while significantly reduced in L1KO mice. * p <0.01, ** p < 0.005 (B-2). I) G-ratio averages. There is no significant difference in the average g-ratio of L1CD mice compared to L1WT mice. J-M) Distribution of g-ratios. There is no significant difference in the distribution of g-ratio in L1CD mice compared to L1WT mice, although L1KO mice have a larger proportion of axons with large g-ratios. *p <0.05, **p <0.01
Figure 9
Figure 9
Expression level of L1 mRNA is normal, but L1 protein expression is dramatically reduced in 7-week-old mice with truncations that remove the ankyrin-binding site. L1 protein localization using L1ex antibody in hippocampus in postnatal day 7 mice A: L1WT, B: L1Y1176A, C: L11180, D: L11152. All L1CD mutant mice show similar distribution of L1 in the hippocampus. Scale bar = 300 μm. E) Western blot analysis of L1 protein in postnatal day 7 mice using L1ex monoclonal antibody. All L1CD mutant mice showed L1 bands, although the band density was a lower in L11180 and L11152 mice compared to L1WT mice. The lower (red) panel shows the GAPDH loading control. F) shows the relative amount of L1-200 kD band density normalized to GAPDH loading control. n=3.*p<0.05. L1 protein localization using L1ex monoclonal antibody in the hippocampus (G: L1WT, H: L1Y1176A, I: L11180, J: L11152) and cerebellum (K: L1WT, L: L1Y1176A, M: L11180, N: L11152) in 7-week-old mice. There was almost no L1 in the hippocampus and cerebellum of L11180 and L11152 mice, although L1Y1176A mice have similar expression patterns to L1WT mice. Scale bars = 300 μm. O) Western blot analysis of L1 protein in 7-week-old mice. The L1 band was detected by L1ex antibody in L1CD mice, although there was no band in L1KO mice. The band density of L11180 and L11152 was obviously weaker than L1WT and L1Y1176A mice. The lower (red) band is the GAPDH loading control. P) shows that the relative amount of L1-200 kD band density which is normalized to the GAPDH loading control. The bands density was significantly lower in L11180 and L11152 mice compared to L1WT mice. L1WT n = 3, L1Y1176A n = 3, L11180 n = 3, L11152 n = 3. *p < 0.01. Q) Quantitative analysis of L1 mRNA in 7-week-old mice. The L1 mRNA relative amount, normalized to β-actin, showed no significant difference in L1CD mutant mice compared to L1WT mice. L1WT n = 3, L1Y1176A n = 3, L11180 n = 3, L11152 n = 3.

Similar articles

Cited by

References

    1. Alamed J, Wilcock DM, Diamond DM, Gordon MN, Morgan D. Two-day radial-arm water maze learning and memory task; robust resolution of amyloid-related memory deficits in transgenic mice. Nat Protoc. 2006;1(4):1671–1679. - PubMed
    1. Barbin G, Aigrot MS, Charles P, Foucher A, Grumet M, Schachner M, Zalc B, Lubetzki C. Axonal cell-adhesion molecule L1 in CNS myelination. Neuron Glia Biol. 2004;1(1):65–72. - PubMed
    1. Brittis PA, Lemmon V, Rutishauser U, Silver J. Unique changes of ganglion cell growth cone behavior following cell adhesion molecule perturbations: a time-lapse study of the living retina. Mol Cell Neurosci. 1995;6(5):433–449. - PubMed
    1. Buhusi M, Schlatter MC, Demyanenko GP, Thresher R, Maness PF. L1 interaction with ankyrin regulates mediolateral topography in the retinocollicular projection. J Neurosci. 2008;28(1):177–188. - PMC - PubMed
    1. Castellani V. The function of neuropilin/L1 complex. Adv Exp Med Biol. 2002;515:91–102. - PubMed

Publication types

MeSH terms

Substances