

Analysis of whole genome biomarker expression in blood and brain
- PMID: 20127885
- PMCID: PMC3098564
- DOI: 10.1002/ajmg.b.31062
Analysis of whole genome biomarker expression in blood and brain
Abstract
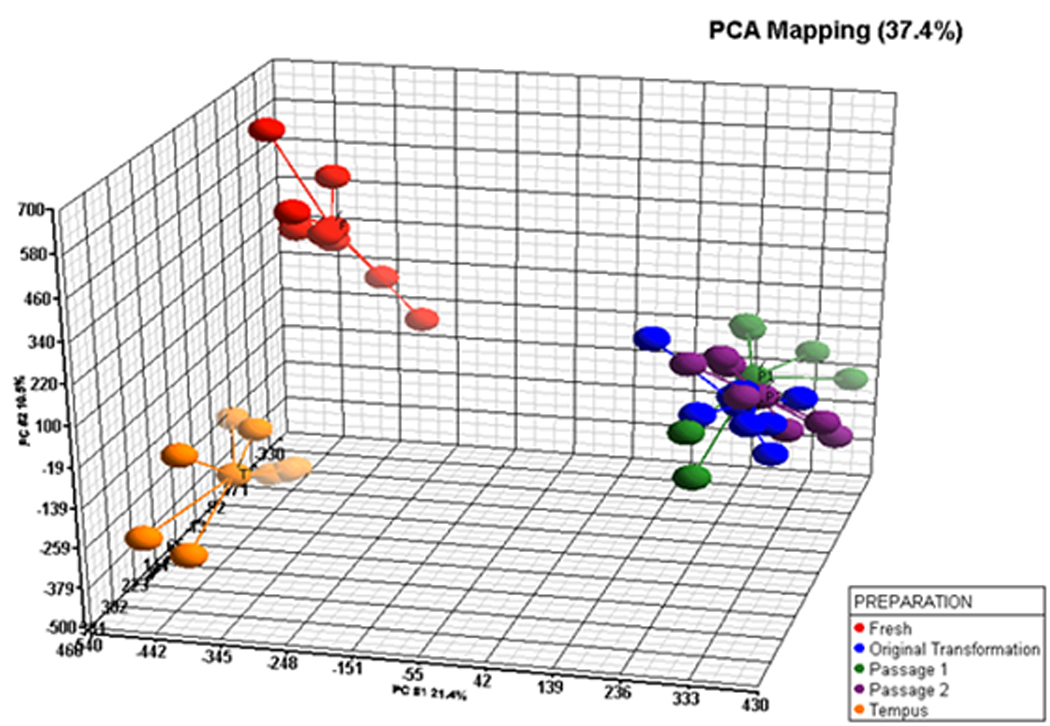
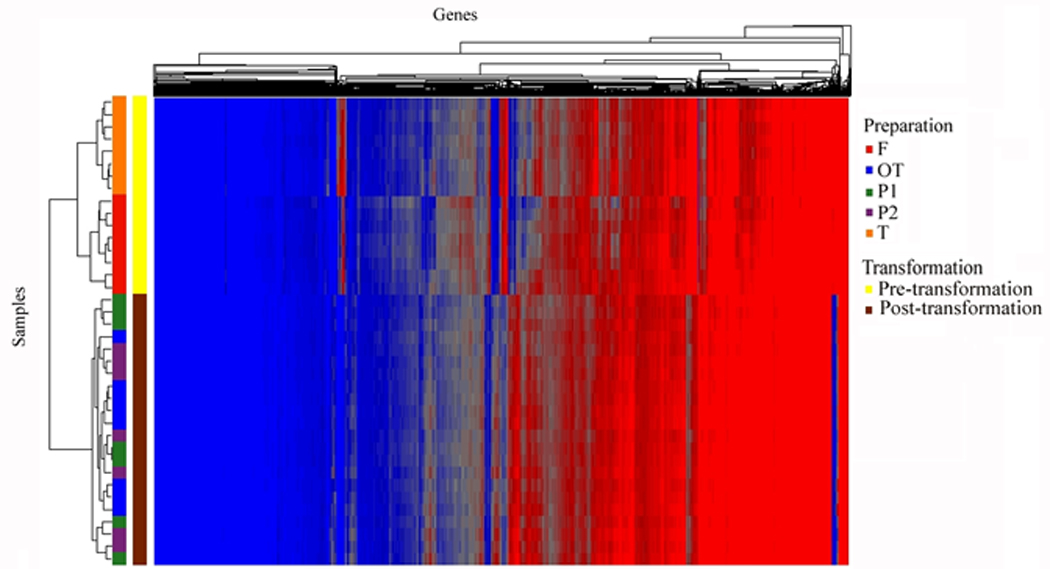
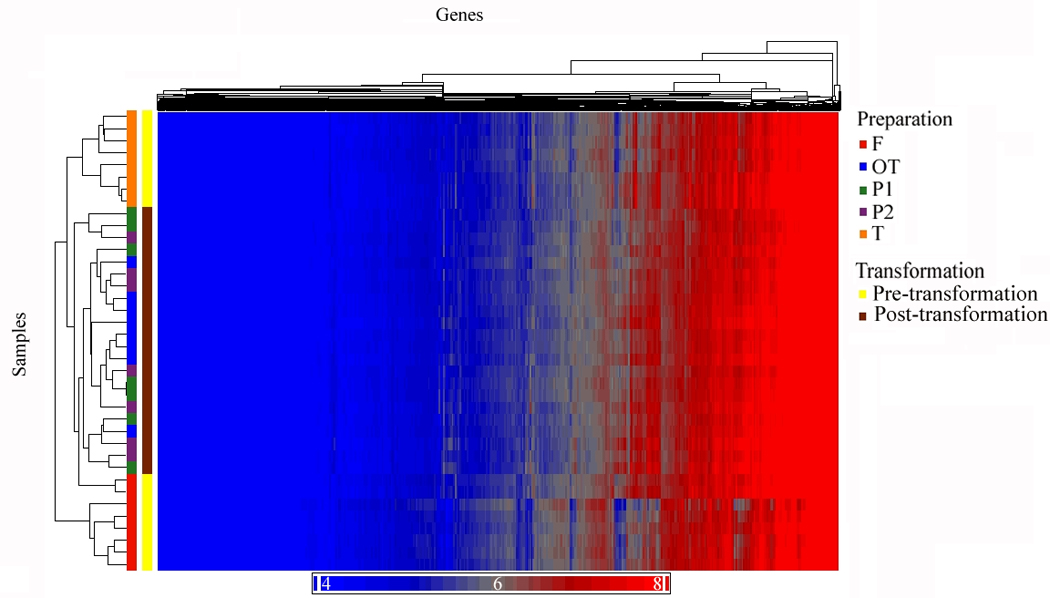
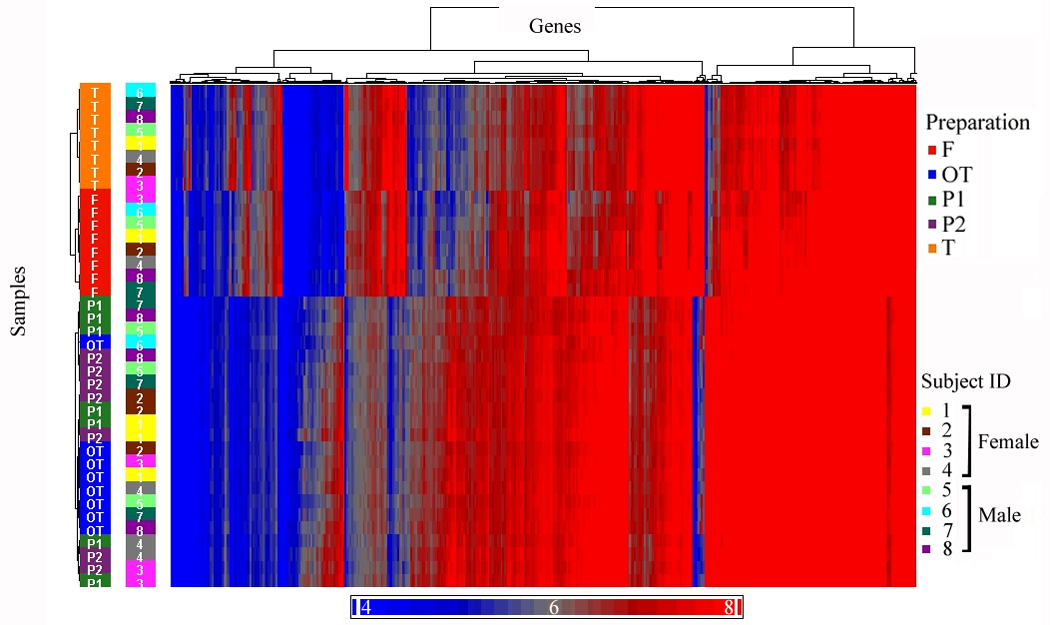
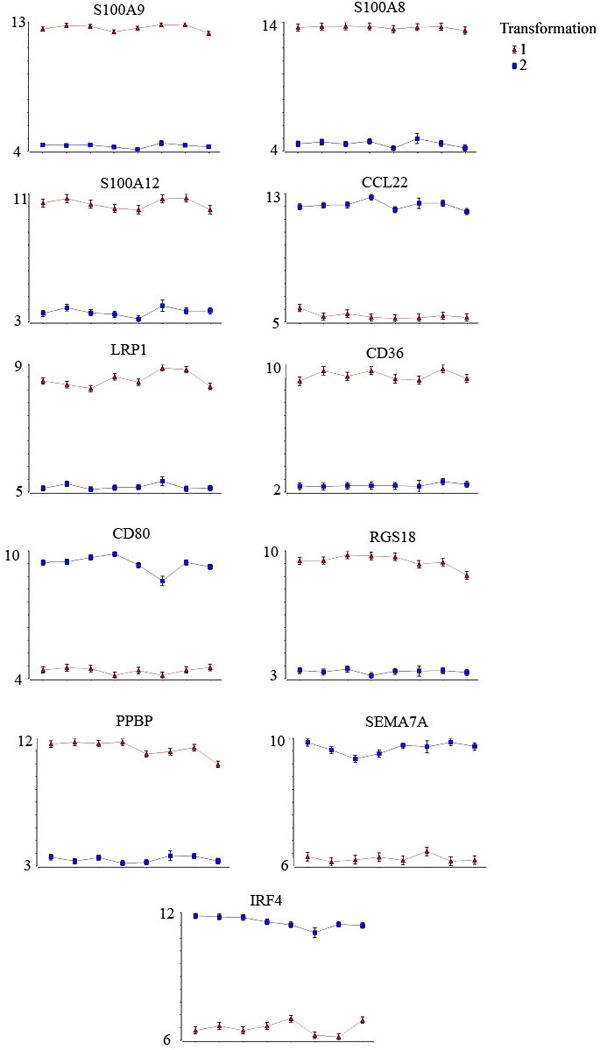
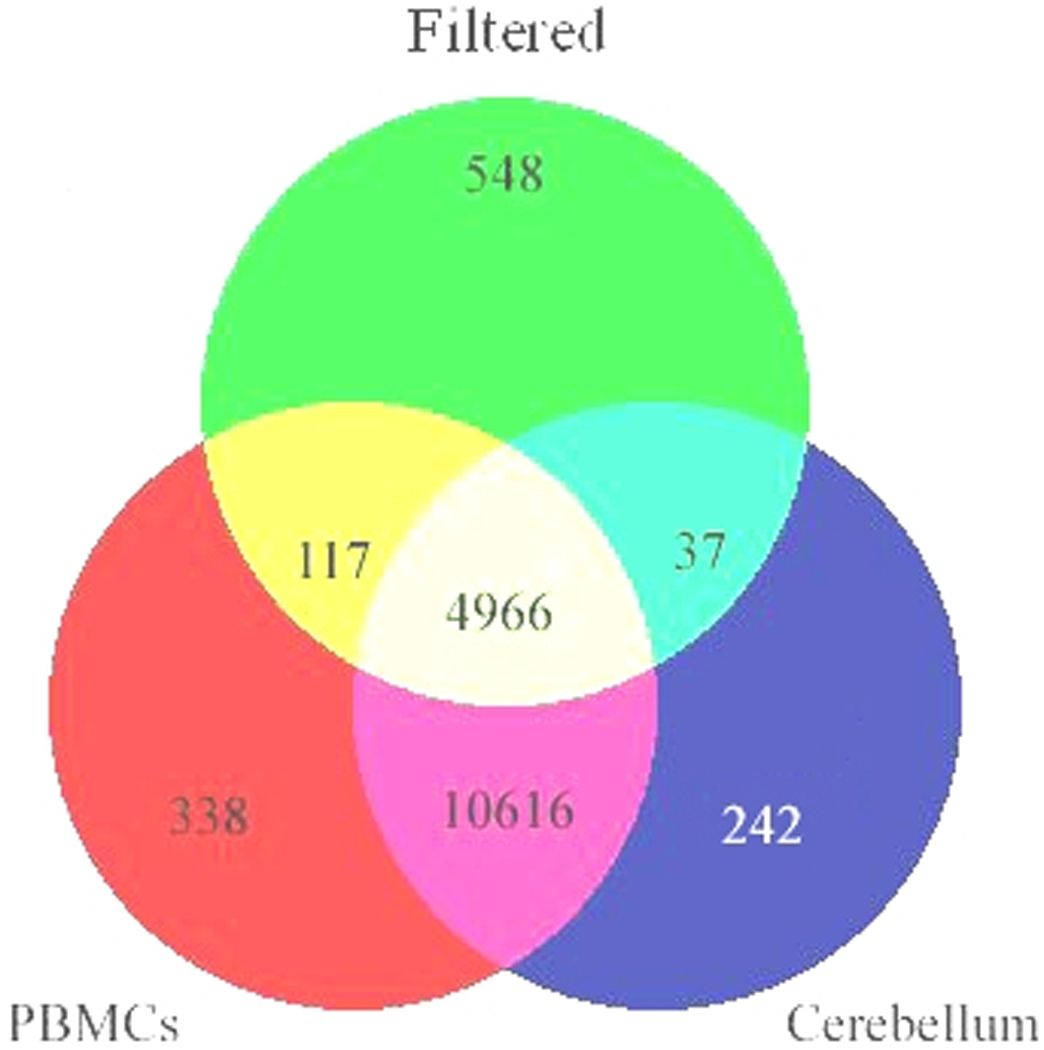
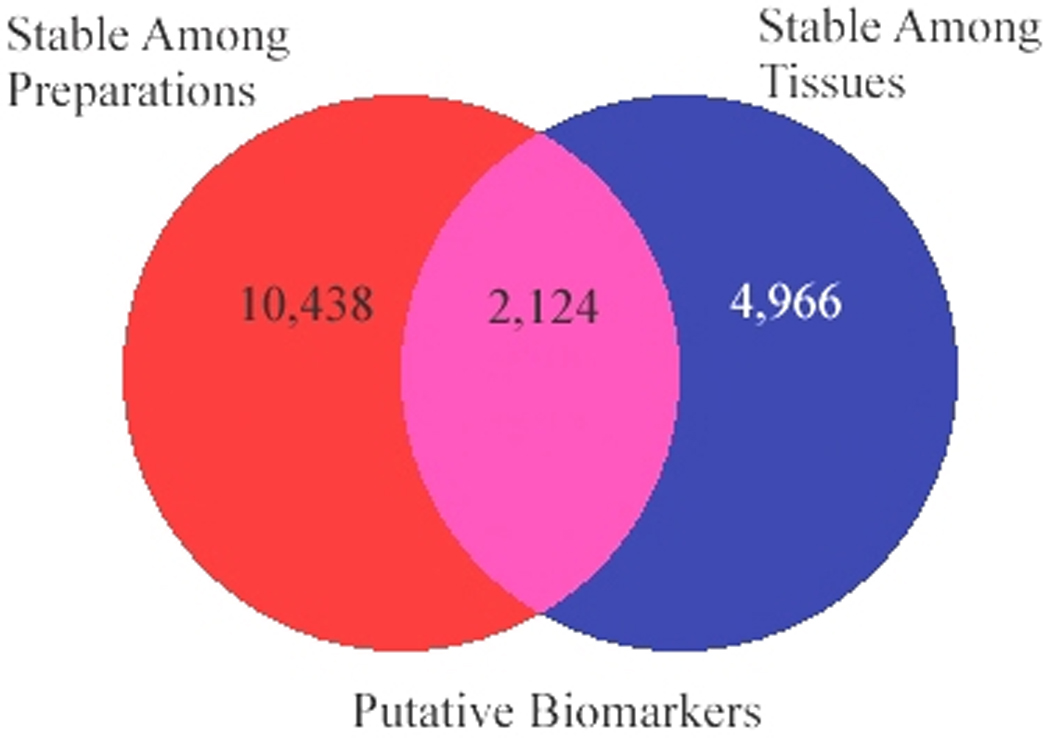
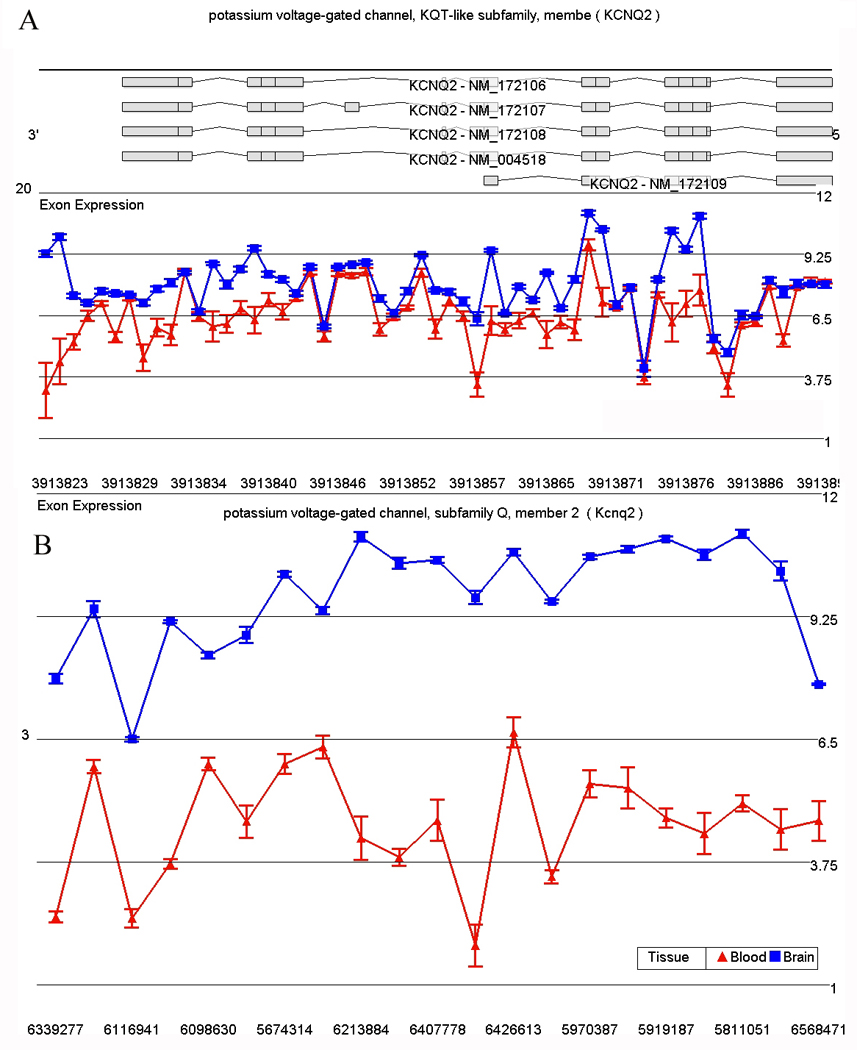
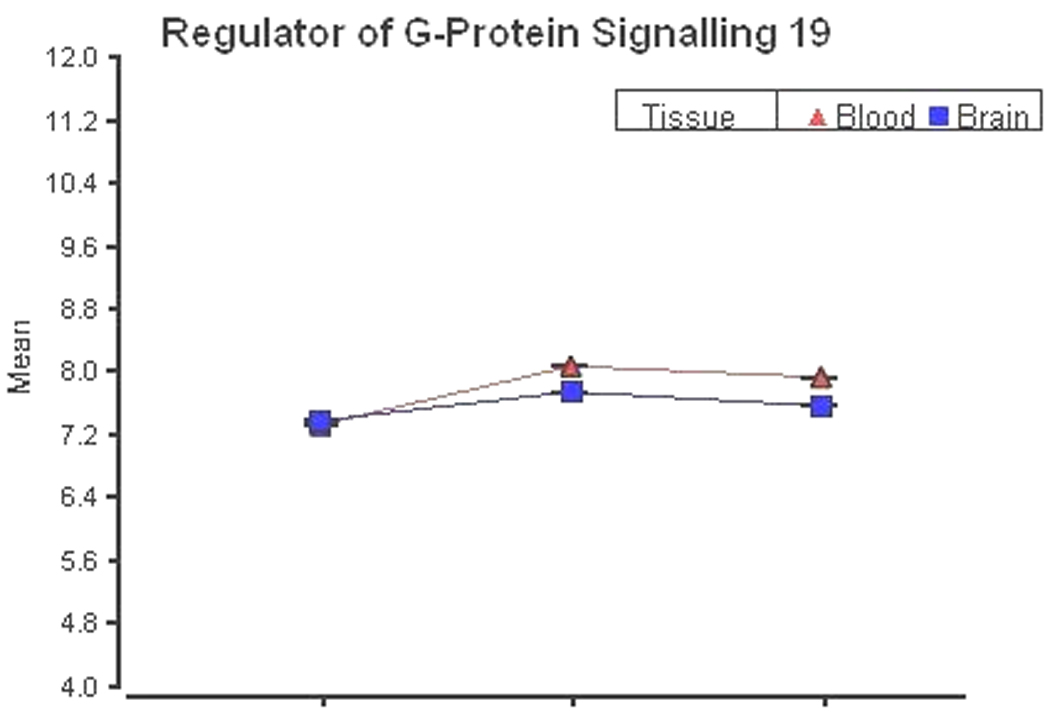
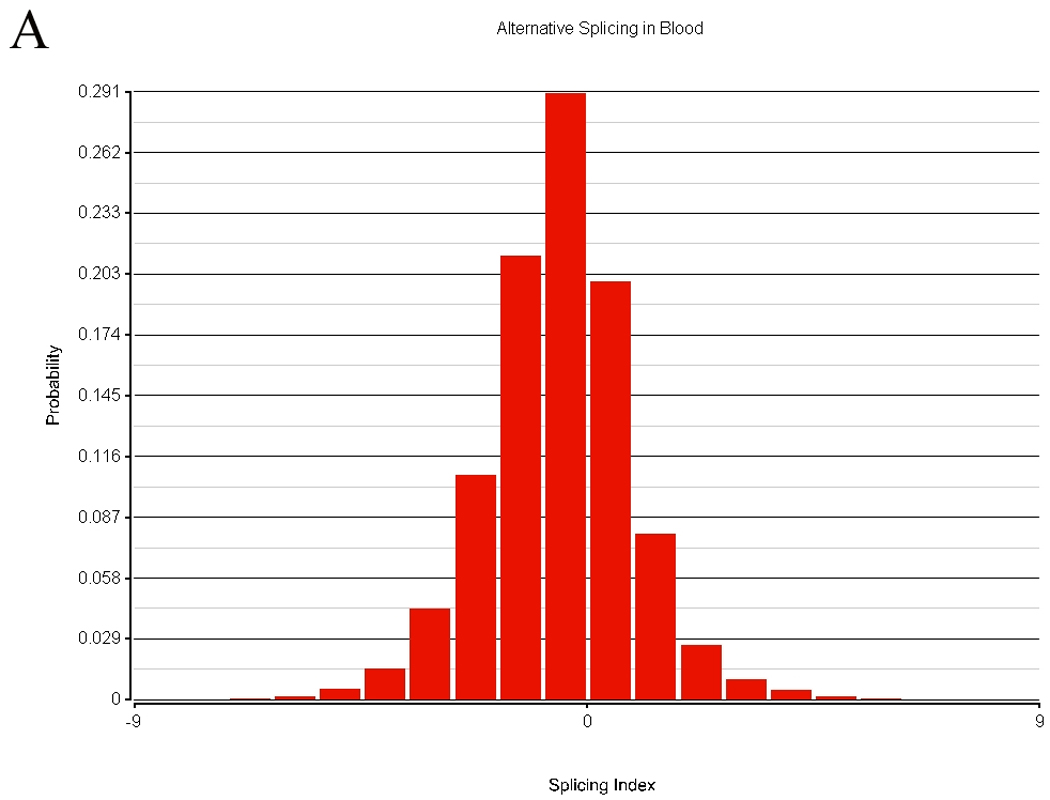
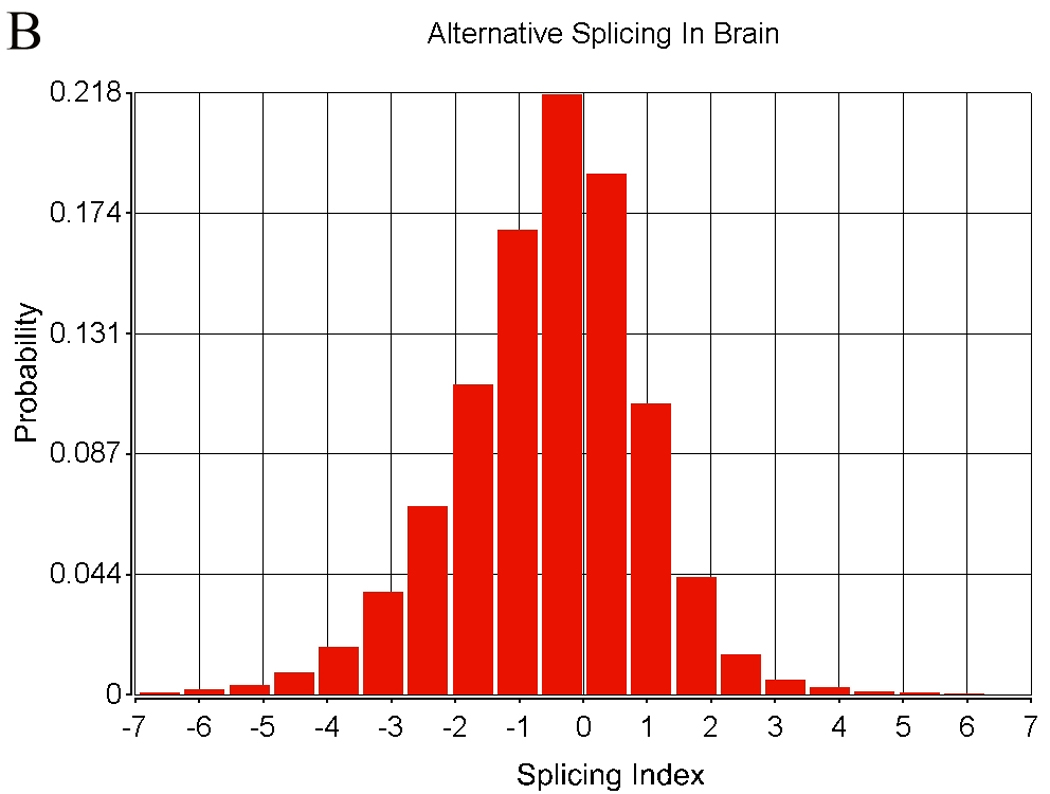
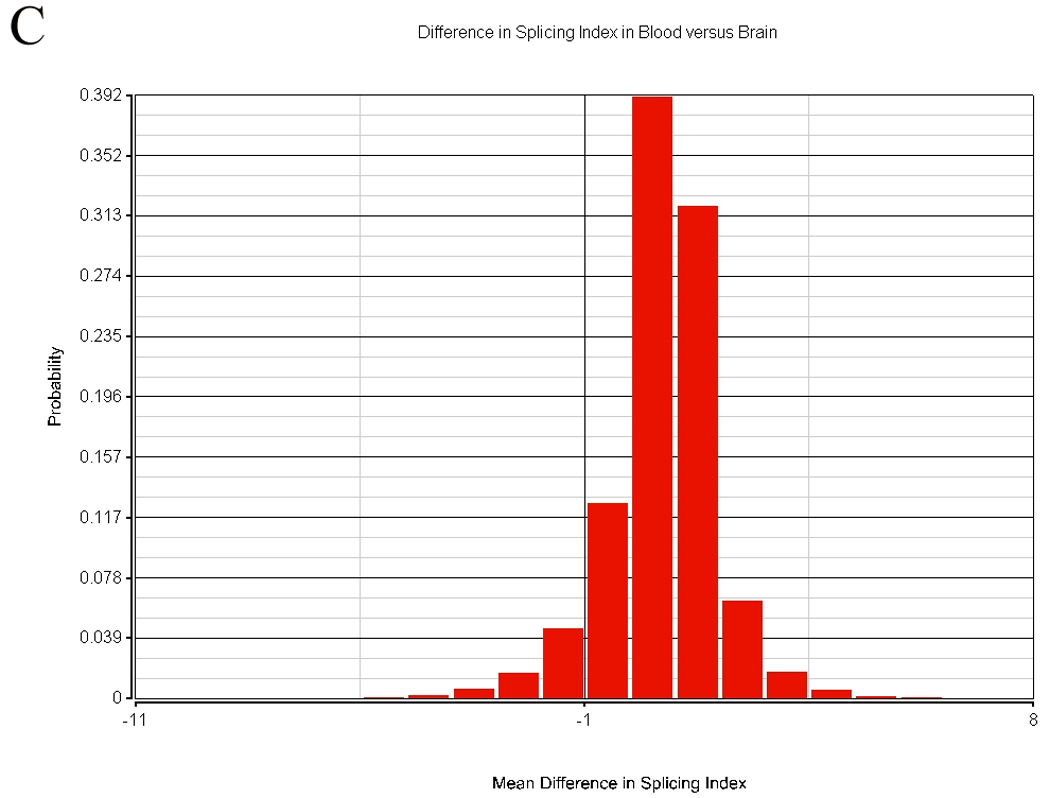
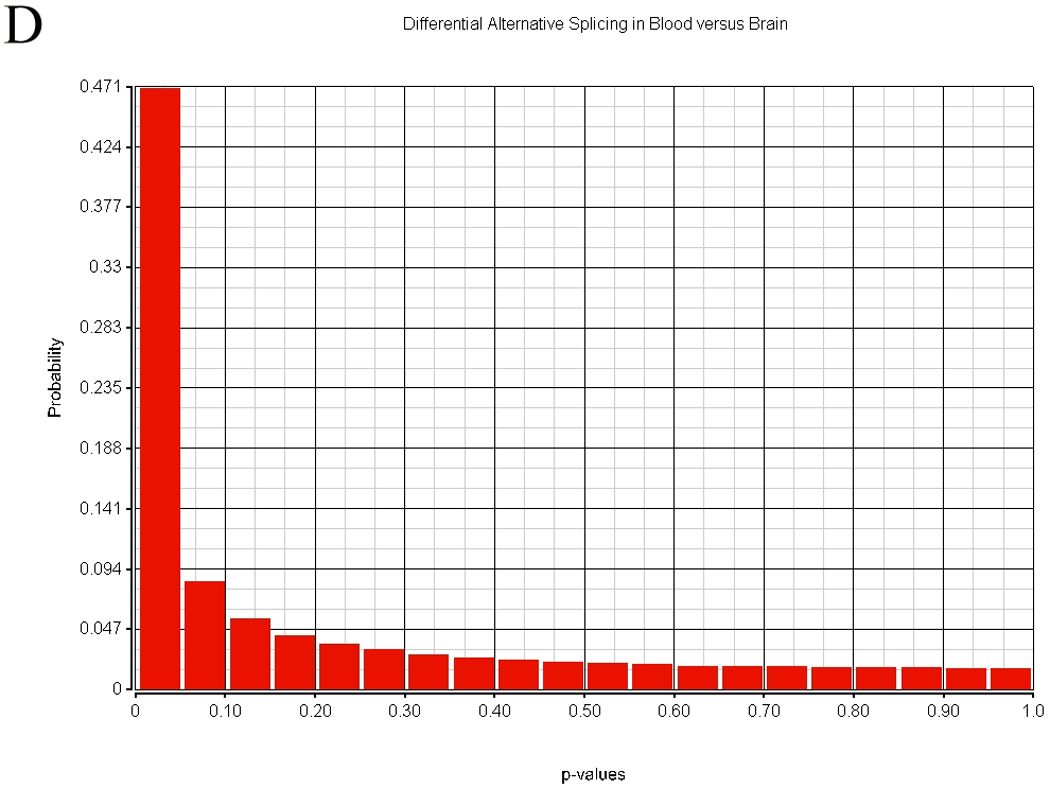
The consistency of peripheral gene expression data and the overlap with brain expression has not been evaluated in biomarker discovery, nor has it been reported in multiple tissues from the same subjects on a genome wide transcript level. The effects of processing whole blood, transformation, and passaged cell lines on gene expression profiling was studied in healthy subjects using Affymetrix arrays. Ficoll extracted peripheral blood mononuclear cells (PBMCs), Epstein-Barr virus (EBV) transformed lymphocytes, passaged lymphoblastic cell lines (LCLs), and whole blood from Tempus tubes were compared. There were 6,813 transcripts differentially expressed between different methods of blood preparation. Principal component analysis resolved two partitions involving pre- and post-transformation EBV effects. Combining results from Affymetrix arrays, postmortem subjects' brain and PBMC profiles showed co-expression levels of summarized transcripts for 4,103 of 17,859 (22.9%) RefSeq transcripts. In a control experiment, rat hemi-brain and blood showed similar expression levels for 19% of RefSeq transcripts. After filtering transcripts that were not significantly different in abundance between human cerebellum and PBMCs from the Affymetrix exon array the correlation in mean transcript abundance was high as expected (r = 0.98). Differences in the alternative splicing index in brain and blood were found for about 90% of all transcripts examined. This study demonstrates over 4,100 brain transcripts co-expressed in blood samples can be further examined by in vitro and in vivo experimental studies of blood and cell lines from patients with psychiatric disorders.
Conflict of interest statement
Figures
References
-
- Baron CA, Liu SY, Hicks C, Gregg JP. Utilization of lymphoblastoid cell lines as a system for the molecular modeling of autism. J Autism Dev Disord. 2006;36(8):973–982. - PubMed
-
- Becker KG, Barnes KC, Bright TJ, Wang SA. The genetic association database. Nat Genet. 2004;36(5):431–432. - PubMed
-
- Boneberg EM, von Seydlitz E, Propster K, Watzl H, Rockstroh B, Illges H. D3 dopamine receptor mRNA is elevated in T cells of schizophrenic patients whereas D4 dopamine receptor mRNA is reduced in CD4+ -T cells. J Neuroimmunol. 2006;173(1–2):180–187. - PubMed
-
- Bowden NA, Weidenhofer J, Scott RJ, Schall U, Todd J, Michie PT, Tooney PA. Preliminary investigation of gene expression profiles in peripheral blood lymphocytes in schizophrenia. Schizophr Res. 2006;82(2–3):175–183. - PubMed
Publication types
MeSH terms
Substances
Grants and funding
LinkOut - more resources
Full Text Sources
Other Literature Sources
