. 2010 Mar;159(6):1339-53.
doi: 10.1111/j.1476-5381.2009.00620.x. Epub 2010 Jan 27.

Delta-aminolevulinic acid is a substrate for the amino acid transporter SLC36A1 (hPAT1)

Affiliations

Delta-aminolevulinic acid is a substrate for the amino acid transporter SLC36A1 (hPAT1)

S Frølund et al. Br J Pharmacol. 2010 Mar.

Abstract

Background and purpose: delta-Aminolevulinic acid (ALA) is used in cancer patients for photodynamic diagnosis or therapy. Oral administration of ALA has been used in patients with prostate and bladder cancer. The present aim was to investigate the mechanism of intestinal absorption of ALA and its transport via the amino acid transporter SLC36A1.

Experimental approach: In vitro investigations of ALA affinity for and uptake via SLC36A1 and SLC15A1 were performed in Caco-2 cell monolayers. Interaction of ALA with SLC15A1 was investigated in MDCK/SLC15A1 cells, whereas interactions with SLC36A1 were investigated in COS-7 cells transiently expressing SLC36A1.

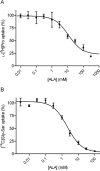
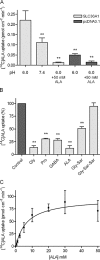
Key results: ALA inhibited SLC36A1-mediated L-[(3)H]Pro and SLC15A1-mediated [(14)C]Gly-Sar uptake in Caco-2 cell monolayers with IC(50) values of 11.3 and 2.1 mM respectively. In SLC36A1-expressing COS-7 cells, the uptake of [(14)C]ALA was saturable with a K(m) value of 6.8 +/- 3.0 mM and a V(max) of 96 +/- 13 pmol x cm(-2) x min(-1). Uptake of [(14)C]ALA was pH and concentration dependent, and could be inhibited by glycine, proline and GABA. In a membrane potential assay, translocation of ALA via SLC36A1 was concentration dependent, with a K(m) value of 3.8 +/- 1.0 mM. ALA is thus a substrate for SLC36A1. In Caco-2 cells, apical [(14)C]ALA uptake was pH dependent, but Na(+) independent, and completely inhibited by 5-hydroxy-L-tryptophan and L-4,4'-biphenylalanyl-l-proline. CONCLUSIONS AND IMPLICATIONS. ALA was a substrate for SLC36A1, and the apical absorption in Caco-2 cell was only mediated by SLC36A1 and SLC15A1. This advances our understanding of intestinal absorption mechanisms of ALA, as well as its potential for drug interactions.


Figures
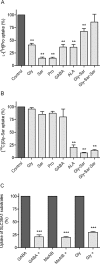
Figure 1
Figure 1
Inhibition of apical uptake of SLC15A1 or SLC36A1 substrates in Caco-2 cells. All compounds were dissolved in HBSS+ containing 10 mM MES; pH adjusted to 6.0 and added to the apical side; HBSS+ at the basolateral side contained 10 mM HEPES, and pH was adjusted to 7.4. Apical uptake was measured for 5 min. (A) The apical uptake of the SLC36A1 substrate l-[3H]Pro (13 nM) was measured in the absence or presence of 30 mM test compound. The uptake measured in the absence of inhibitor was taken as 100% (control). Each bar represents the mean ± SEM of three to five different passages (n= 3–5). One-way anova showed significant (P < 0.0001) differences between the means. **P < 0.01 significantly different from control. (B) The apical uptake of the SLC15A1 substrate [14C]Gly-Sar (18 µM) was measured in the absence or presence of 10 mM test compound. The uptake measured in the absence of inhibitor was taken as 100% (control). Each bar represents the mean ± SEM of three different passages (n= 3). One-way anova showed significant (P < 0.0001) differences between the means **P < 0.01 significantly different from control. (C) The apical uptake of the SLC36A1 substrate [3H]GABA (GABA, 14 nM), [14C]MeAIB (MeAIB, 9 µM) or [14C]Gly (Gly, 6 µM) was measured in the absence or presence of 30 mM ALA (denoted by +). The uptake measured in the absence of ALA was taken as 100%. Each bar represents the mean ± SEM of three different passages (n= 3). One-way anova showed significant (P < 0.0001) differences between the means. ***P < 0.001 significantly different from the uptake measured in the absence of ALA.
Figure 2
Figure 2
Inhibition of apical l-[3H]Pro or [14C]Gly-Sar uptake by ALA in Caco-2 cells. All compounds were dissolved in HBSS+ containing 10 mM MES; pH adjusted to 6.0 and added to the apical side; HBSS+ at the basolateral side contained 10 mM HEPES, and pH was adjusted to 7.4. Apical uptake was measured for 5 min. (A) The apical uptake of l-[3H]Pro (13 nM) was measured in the absence or presence of increasing concentrations of ALA. The uptake measured in the absence of ALA was taken as 100%. The IC50 value was estimated using Eqn 2 to 11.3 mM (logIC50 of 1.05 ± 0.128). Each data point represents the mean ± SEM of three different passages (n= 3). (B) The apical uptake of [14C]Gly-Sar (18 µM) was measured in the absence or presence of increasing concentrations of ALA. The uptake measured in the absence of ALA was taken as 100%. The IC50 value was estimated using Eqn 2 to 2.1 mM (logIC50 of 0.327 ± 0.078). Each data point represents the mean ± SEM of three different passages (n= 3).
Figure 3
Figure 3
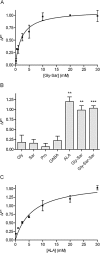
Translocation via SLC15A1 in MDCK cells stably transfected with SLC15A1. The experimental data were generated using the fluorescence-based FLIPR membrane potential assay (see Methods). The relative change in fluorescence (ΔF*, see Eqn 1) is the SLC15A1-specific change in fluorescence recorded after electrogenic transport of a compound relative to the SLC15A1-specific change in fluorescence recorded after the addition of 20 mM Gly-Sar. The changes in fluorescence are thus normalized to the changes in fluorescence measured with 20 mM Gly-Sar. All recordings were done in HBSS+ buffer containing 10 mM MES, pH adjusted to 6.0. (A) Concentration-dependent relative change in fluorescence caused by Gly-Sar via SLC15A1. The relative change in fluorescence (ΔF*) was analysed using Eqn 3, giving a Km value of 2.3 ± 0.56 mM, and a ΔF*max of 1.1 ± 0.07 of the response given by 20 mM Gly-Sar. Each data point represents the mean ± SEM of four different passages (n= 4). (B) Relative change in fluorescence caused by the test compounds via SLC15A1. The SLC15A1-specific change in fluorescence recorded in the presence of 30 mM compound was related to the SLC15A1-specific change in fluorescence measured in the presence of 20 mM Gly-Sar. Each bar represents the mean ± SEM of four different passages (n= 4). ***P < 0.001 and **P < 0.01 significantly different from zero. (C) Concentration-dependent relative change in fluorescence caused by ALA via SLC15A1. The relative change in fluorescence (ΔF*) was analysed using Eqn 3, giving a Km value of 6.4 ± 1.5 mM, and a ΔF*max of 1.7 ± 0.14 of the response given by 20 mM Gly-Sar. Each data point represents the mean ± SEM for three different passages (n= 3).
Figure 4
Figure 4
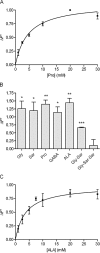
Translocation via SLC36A1 in COS-7 cells transiently transfected with SLC36A1. The experimental data were generated using the fluorescence-based FLIPR membrane potential assay (see Methods). The relative change in fluorescence (ΔF*, see Eqn 1) is the SLC36A1-specific change in fluorescence recorded after electrogenic transport of a compound relative to the SLC36A1-specific change in fluorescence recorded after the addition of 20 mM Pro. The changes in fluorescence are thus normalized to the changes in fluorescence measured with 20 mM Pro. All recordings were done in Na+-free HBSS+ buffer containing 10 mM MES, pH adjusted to 6.0. (A) Concentration-dependent relative change in fluorescence caused by Pro via SLC36A1. The relative change in fluorescence (ΔF*) was analysed using Eqn 3, giving a Km value of 4.7 ± 0.8 mM, and a ΔF*max of 1.1 ± 0.06 of the response given by 20 mM Pro. Each data point represents the mean ± SEM of three different passages (n= 3). (B) Relative change in fluorescence caused by the test compounds via SLC36A1. The SLC36A1-specific change in fluorescence recorded in the presence of 30 mM compound was related to the SLC36A1-specific change in fluorescence measured in the presence of 20 mM Pro. Each bar represents the mean ± SEM of three different passages (n= 3). ***P < 0.001, **P < 0.01 and *P < 0.05 significantly different from zero. (C) Concentration-dependent relative change in fluorescence caused by ALA via SLC36A1. The relative change in fluorescence (ΔF*) was analysed using Eqn 3, giving a Km value of 3.8 ± 1.0 mM, and a ΔF*max of 0.98 ± 0.08 of the response given by 20 mM Pro. Each data point represents the mean ± SEM for three different passages (n= 3).
Figure 5
Figure 5
[14C]ALA uptake via SLC36A1 in COS-7 cells transiently transfected with SLC36A1. The uptake of [14C]ALA (9 µM) in COS-7 cells transiently transfected with SLC36A1 or pcDNA3.1. Uptake was measured for 20 min in Na+-free HBSS+ containing 10 mM MES, pH adjusted to 6.0, unless otherwise stated. (A) [14C]ALA uptake (pmol·cm−2·min−1) in SLC36A1 or pcDNA3.1-transfected COS-7 cells. Uptake was measured in Na+-free HBSS+ containing 10 mM MES, pH adjusted to 6.0, or Na+-free HBSS+ containing 10 mM HEPES, pH adjusted to pH 7.4 with or without 50 mM ALA. Each bar represents the mean ± SEM for four different passages (n= 4). One-way anova showed significant (P < 0.0001) differences between the means. **P < 0.01 significantly different from the uptake at pH 6.0 in SLC36A1-transfected COS-7 cells. (B) The SLC36A1-specific uptake of [14C]ALA (9 µM) in the presence of 30 mM test compound. The uptake measured in the absence of inhibitor was taken as 100%. Each bar represents the mean ± SEM for three different passages (n= 3). One-way anova showed significant (P < 0.0001) differences between the means. **P < 0.01 significantly different from the control. (C) Concentration-dependent uptake of [14C]ALA (pmol·cm−2·min−1) via SLC36A1. The uptake rate was analysed using Eqn 4, giving a Km value of 6.8 ± 3.0 mM, and a Vmax of 96 ± 13 pmol·cm−2·min−1. Each data point represents the mean ± SEM of three different passages (n= 3).
Figure 6
Figure 6
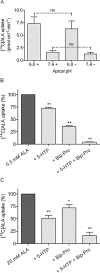
Apical [14C]ALA uptake in Caco-2 cells. The apical uptake of [14C]ALA (9 µM) was measured for 5 min in HBSS+ containing 10 mM MES, pH adjusted to 6.0 at the apical side, and HBSS+ containing 10 mM HEPES, pH adjusted to 7.4 at the basolateral side, unless otherwise stated. (A) The pH and sodium dependency of apical [14C]ALA uptake. Uptake was measured at apical pH 6.0 or 7.4 in the absence (shown as –) or presence (shown as +) of sodium. The apical side was buffered with HBSS+ or Na+-free HBSS+ containing either 10 mM MES, pH adjusted to 6.0, or 10 mM HEPES, pH adjusted to 7.4. The basolateral side was buffered with HBSS+ or Na+-free HBSS+ containing 10 mM HEPES, pH adjusted to 7.4. Each bar represents the mean ± SEM of three different passages (n= 3). NS denotes no significant difference between uptake measured in the presence or absence of sodium. (B) Inhibition of apical uptake of 0.5 mM [14C]ALA. Uptake was measured in the absence or presence of 10 mM 5-HTP (+ 5-HTP), 0.5 mM Bip-Pro (+ Bip-Pro) or 10 mM 5-HTP and 0.5 mM Bip-Pro (+ 5-HTP + Bip-Pro). The uptake measured in the absence of inhibitor was taken as 100%. Each bar represents the mean ± SEM of three different passages (n= 3). One-way anova showed significant (P < 0.0001) differences between the means. **P < 0.01 significantly different from the uptake measured in the absence of inhibitor. (C) Inhibition of apical uptake of 25 mM [14C]ALA. Uptake was measured in the absence or presence of 10 mM 5-HTP (+ 5-HTP), 0.5 mM Bip-Pro (+ Bip-Pro) or 10 mM 5-HTP and 0.5 mM Bip-Pro (+ 5-HTP + Bip-Pro). The uptake measured in the absence of inhibitor was taken as 100%. Each bar represents the mean ± SEM of three different passages (n= 3). One-way anova showed significant (P < 0.0001) differences between the means. **P < 0.01 significantly different from the uptake measured in the absence of inhibitor.

Similar articles

Cited by

References

    1. Abbot EL, Grenade DS, Kennedy DJ, Gatfield KM, Thwaites DT. Vigabatrin transport across the human intestinal epithelial (Caco-2) brush-border membrane is via the H+-coupled amino-acid transporter hPAT1. Br J Pharmacol. 2006;147:298–306. - PMC - PubMed
    1. Addison JM, Burston D, Matthews DM. Evidence for active transport of the dipeptide glycylsarcosine by hamster jejunum in vitro. Clin Sci. 1972;43:907–911. - PubMed
    1. Alexander SP, Mathie A, Peters JA. Guide to Receptors and Channels (GRAC), 3rd edn. Br J Pharmacol. 2008;153(Suppl. 2):S1–209. - PMC - PubMed
    1. Andersen R, Nielsen CU, Begtrup M, Jorgensen FS, Brodin B, Frokjaer S, et al. In vitro evaluation of N-methyl amide tripeptidomimetics as substrates for the human intestinal di-/tri-peptide transporter hPEPT1. Eur J Pharm Sci. 2006;28:325–335. - PubMed
    1. Anderson CM, Grenade DS, Boll M, Foltz M, Wake KA, Kennedy DJ, et al. H+/amino acid transporter 1 (PAT1) is the imino acid carrier: an intestinal nutrient/drug transporter in human and rat. Gastroenterology. 2004;127:1410–1422. - PubMed

Publication types

MeSH terms