

In vivo voltammetric monitoring of norepinephrine release in the rat ventral bed nucleus of the stria terminalis and anteroventral thalamic nucleus
- PMID: 20128849
- PMCID: PMC2852115
- DOI: 10.1111/j.1460-9568.2009.07005.x
In vivo voltammetric monitoring of norepinephrine release in the rat ventral bed nucleus of the stria terminalis and anteroventral thalamic nucleus
Abstract
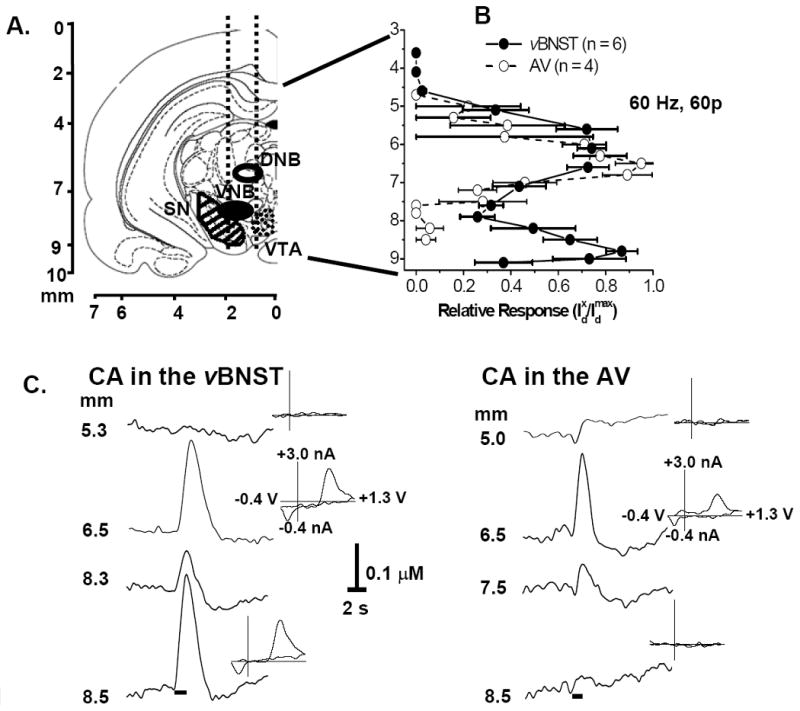
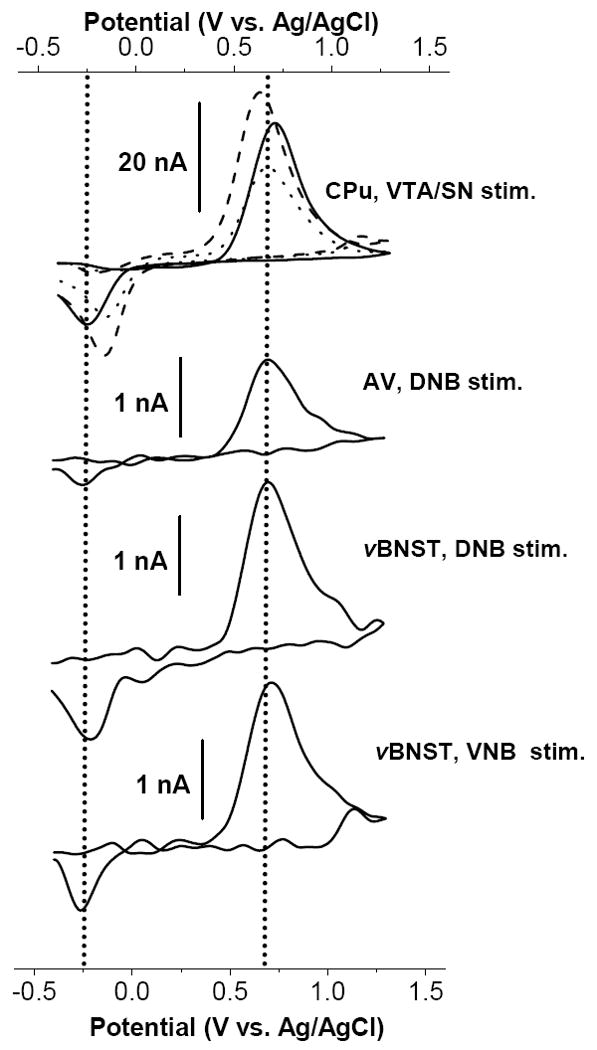
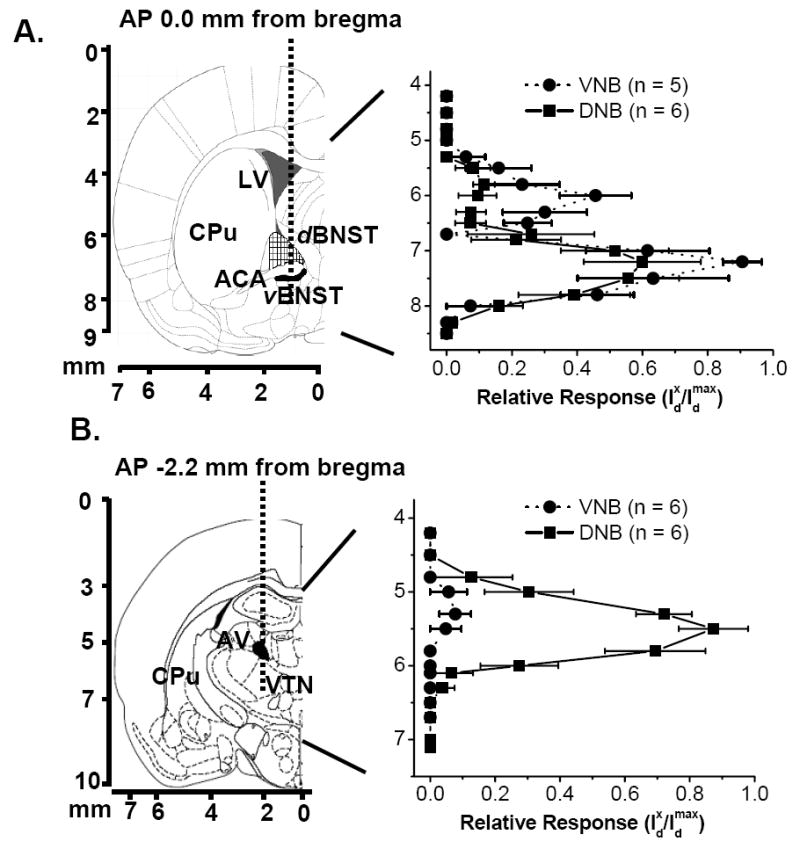
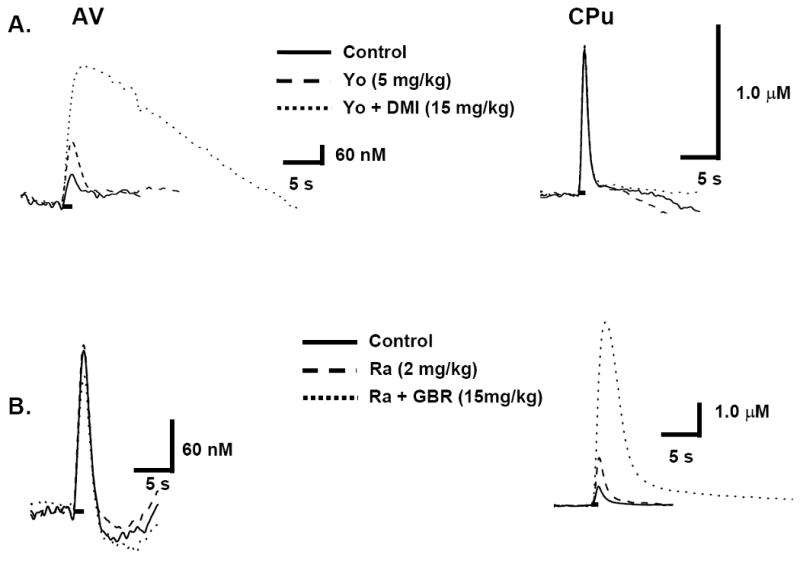
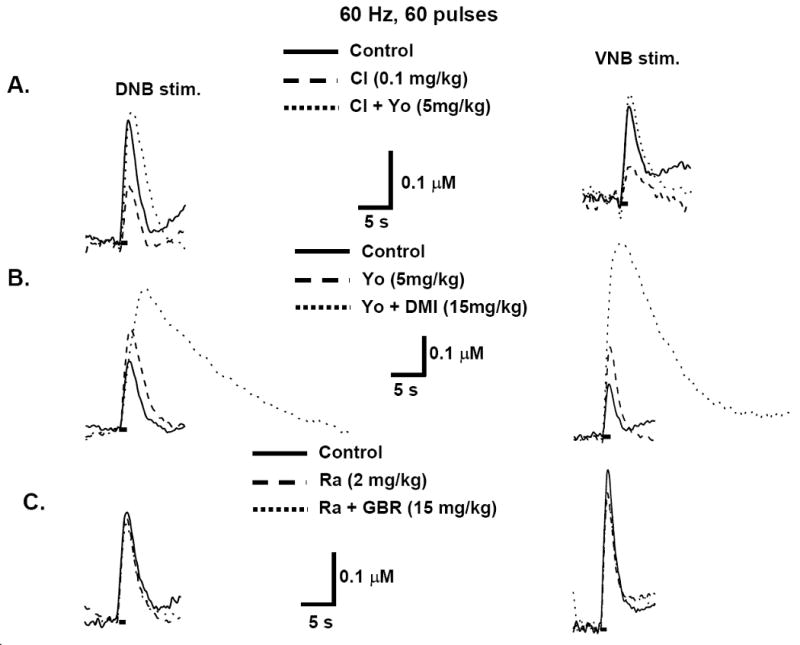
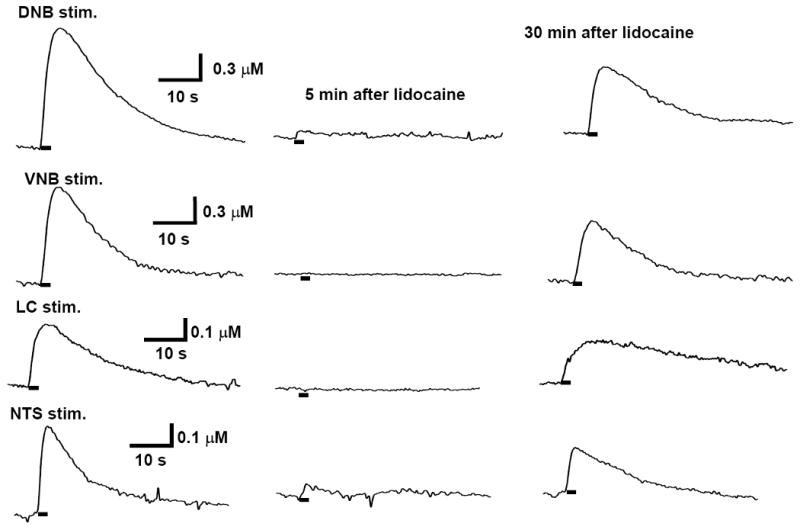
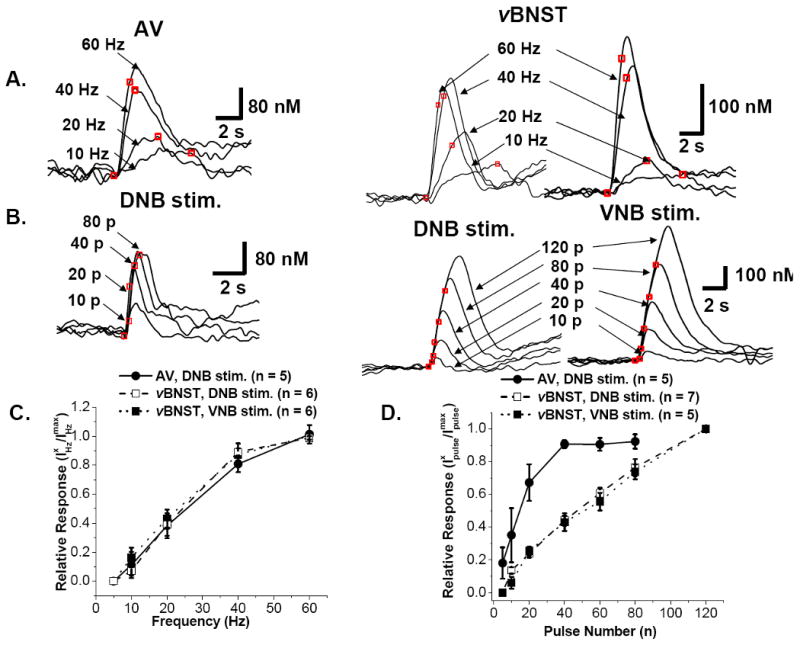
The role and contribution of the dense noradrenergic innervation in the ventral bed nucleus of the stria terminalis (vBNST) and anteroventral thalamic nucleus (AV) to biological function and animal behaviors is poorly understood due to the small size of these nuclei. The aim of this study was to compare norepinephrine release and uptake in the vBNST with that in the AV of anesthetized rats. Measurements were made in vivo with fast-scan cyclic voltammetry following electrical stimulation of noradrenergic projection pathways, either the dorsal noradrenergic bundle (DNB) or the ventral noradrenergic bundle (VNB). The substance detected was identified as norepinephrine based upon voltammetric, anatomical, neurochemical and pharmacological evidence. Fast-scan cyclic voltammetry enables the selective monitoring of local norepinephrine overflow in the vBNST evoked by the stimulation of either the DNB or the VNB while norepinephrine in the AV was only evoked by DNB stimulation. The alpha2-adrenoceptor antagonist yohimbine and the norepinephrine uptake inhibitor desipramine increased norepinephrine overflow and slowed its disappearance in both regions. However, control of extracellular norepinephrine by both autoreceptors and uptake was greater in the AV. The greater control exerted by autoreceptors and uptake in the AV resulted in reduced extracellular concentration compared with the v BNST when large numbers of stimulation pulses were employed. The differences in noradrenergic transmission observed in the terminal fields of the v BNST and the AV may differentially regulate activity in these two regions that both contain high densities of norepinephrine terminals.
Figures
Similar articles
-
In vivo comparison of norepinephrine and dopamine release in rat brain by simultaneous measurements with fast-scan cyclic voltammetry.J Neurochem. 2011 Dec;119(5):932-44. doi: 10.1111/j.1471-4159.2011.07494.x. Epub 2011 Oct 20. J Neurochem. 2011. PMID: 21933188 Free PMC article.
-
In vivo voltammetric monitoring of catecholamine release in subterritories of the nucleus accumbens shell.Neuroscience. 2010 Aug 11;169(1):132-42. doi: 10.1016/j.neuroscience.2010.04.076. Epub 2010 May 6. Neuroscience. 2010. PMID: 20451589 Free PMC article.
-
Opposing catecholamine changes in the bed nucleus of the stria terminalis during intracranial self-stimulation and its extinction.Biol Psychiatry. 2013 Jul 1;74(1):69-76. doi: 10.1016/j.biopsych.2012.11.008. Epub 2012 Dec 20. Biol Psychiatry. 2013. PMID: 23260335 Free PMC article.
-
In vivo voltammetry monitoring of electrically evoked extracellular norepinephrine in subregions of the bed nucleus of the stria terminalis.J Neurophysiol. 2012 Mar;107(6):1731-7. doi: 10.1152/jn.00620.2011. Epub 2011 Dec 21. J Neurophysiol. 2012. PMID: 22190618 Free PMC article.
-
Role of noradrenergic projections to the bed nucleus of the stria terminalis in the regulation of the hypothalamic-pituitary-adrenal axis.Brain Res Brain Res Rev. 2004 Dec;47(1-3):145-60. doi: 10.1016/j.brainresrev.2004.07.011. Brain Res Brain Res Rev. 2004. PMID: 15572169 Review.
Cited by
-
Fast-scan cyclic voltammetry analysis of dynamic serotonin reponses to acute escitalopram.ACS Chem Neurosci. 2013 May 15;4(5):715-20. doi: 10.1021/cn4000378. Epub 2013 Apr 24. ACS Chem Neurosci. 2013. PMID: 23597074 Free PMC article.
-
β-adrenergic signaling broadly contributes to LTP induction.PLoS Comput Biol. 2017 Jul 24;13(7):e1005657. doi: 10.1371/journal.pcbi.1005657. eCollection 2017 Jul. PLoS Comput Biol. 2017. PMID: 28742159 Free PMC article.
-
Anatomical and pharmacological characterization of catecholamine transients in the medial prefrontal cortex evoked by ventral tegmental area stimulation.Synapse. 2014 Apr;68(4):131-43. doi: 10.1002/syn.21723. Epub 2013 Nov 28. Synapse. 2014. PMID: 24285555 Free PMC article.
-
A Genetically Encoded Fluorescent Sensor for Rapid and Specific In Vivo Detection of Norepinephrine.Neuron. 2019 May 22;102(4):745-761.e8. doi: 10.1016/j.neuron.2019.02.037. Epub 2019 Mar 25. Neuron. 2019. PMID: 30922875 Free PMC article.
-
Examining the complex regulation and drug-induced plasticity of dopamine release and uptake using voltammetry in brain slices.ACS Chem Neurosci. 2013 May 15;4(5):693-703. doi: 10.1021/cn400026v. Epub 2013 May 6. ACS Chem Neurosci. 2013. PMID: 23581570 Free PMC article. Review.
References
-
- Aston-Jones G, Cohen JD. An integrative theory of locus coeruleus-norepinephrine function: adaptive gain and optimal performance. Annu Rev Neurosci. 2005;28:403–450. - PubMed
-
- Berridge CW, Waterhouse BD. The locus coeruleus-noradrenergic system: modulation of behavioral state and state-dependent cognitive processes. Brain Res Brain Res Rev. 2003;42:33–84. - PubMed
-
- Boehnke SE, Rasmusson DD. Time course and effective spread of lidocaine and tetrodotoxin delivered via microdialysis: an electrophysiological study in cerebral cortex. J Neurosci Methods. 2001;105:133–141. - PubMed
-
- Brun P, Suaud-Chagny MF, Gonon F, Buda M. In vivo noradrenaline release evoked in the anteroventral thalamic nucleus by locus ceruleus activation: an electrochemical study. Neuroscience. 1993;52:961–972. - PubMed
-
- Cahill PS, Wightman RM. Simultaneous amperometric measurement of ascorbate and catecholamine secretion from individual bovine adrenal medullary cells. Anal Chem. 1995;67:2599–2605. - PubMed
Publication types
MeSH terms
Substances
Grants and funding
LinkOut - more resources
Full Text Sources
