. 2010 Feb 3:11:88.
doi: 10.1186/1471-2164-11-88.

Whole-genome sequencing of a laboratory-evolved yeast strain

Affiliations

Whole-genome sequencing of a laboratory-evolved yeast strain

Carlos L Araya et al. BMC Genomics. .

Abstract

Background: Experimental evolution of microbial populations provides a unique opportunity to study evolutionary adaptation in response to controlled selective pressures. However, until recently it has been difficult to identify the precise genetic changes underlying adaptation at a genome-wide scale. New DNA sequencing technologies now allow the genome of parental and evolved strains of microorganisms to be rapidly determined.

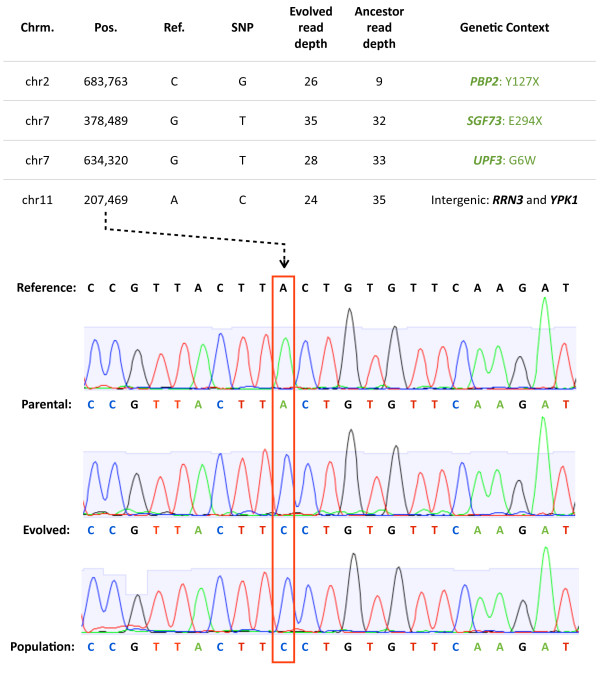
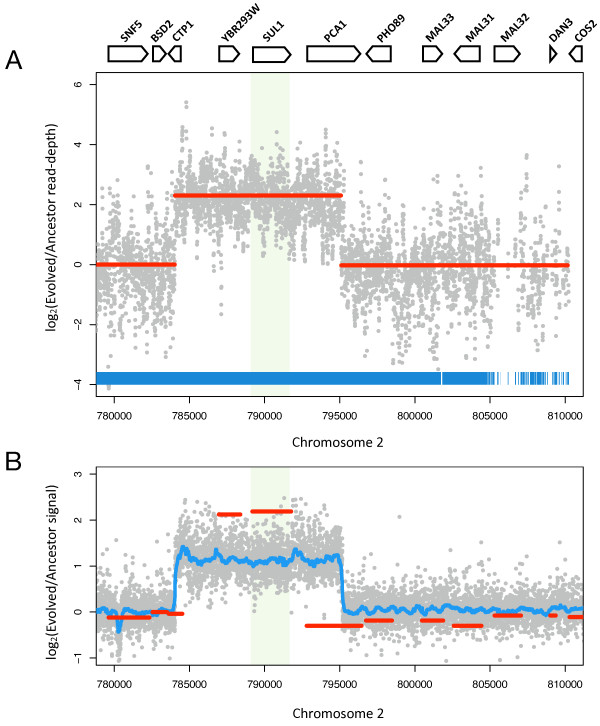
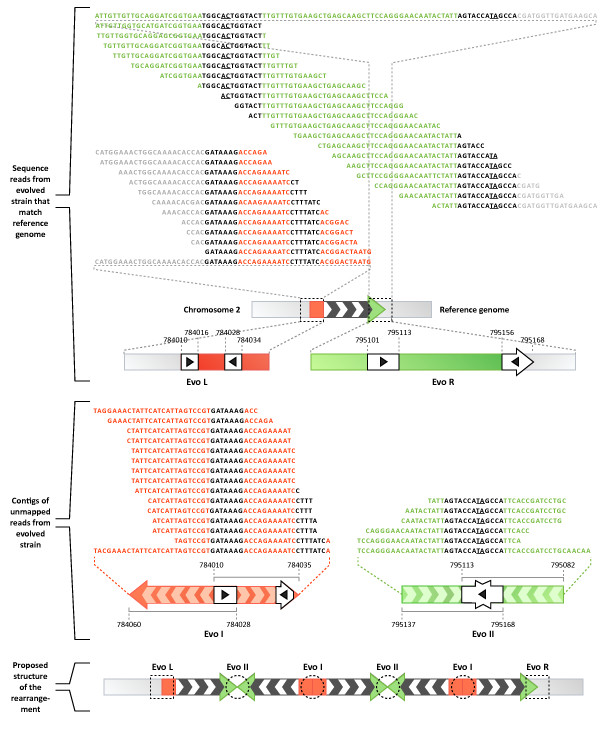
Results: We sequenced >93.5% of the genome of a laboratory-evolved strain of the yeast Saccharomyces cerevisiae and its ancestor at >28x depth. Both single nucleotide polymorphisms and copy number amplifications were found, with specific gains over array-based methodologies previously used to analyze these genomes. Applying a segmentation algorithm to quantify structural changes, we determined the approximate genomic boundaries of a 5x gene amplification. These boundaries guided the recovery of breakpoint sequences, which provide insights into the nature of a complex genomic rearrangement.

Conclusions: This study suggests that whole-genome sequencing can provide a rapid approach to uncover the genetic basis of evolutionary adaptations, with further applications in the study of laboratory selections and mutagenesis screens. In addition, we show how single-end, short read sequencing data can provide detailed information about structural rearrangements, and generate predictions about the genomic features and processes that underlie genome plasticity.


Figures

Figure 1
Figure 1
Point mutation discovery in an evolved yeast genome. SNPs that are supported by a read depth of ≥6 and ≥5 in the evolved and ancestor strain sequence data, respectively, are shown. These SNPS are also supported by ≥80% of the base calls for the position in the evolved strain and ≥70% of the calls in the parental strain. Tiling array-discovered SNPs in DBY11331 are labeled green. Sanger-sequence traces from evolved and ancestor genomes validate the SNP at chr11: 207,469 in the adaptive clone. Sanger sequence data derived from a population sample suggest that the chr11: 207,469 SNP is in high frequency in the evolving population time-point from which the evolved clone was isolated (bottom trace).
Figure 2
Figure 2
A copy-number polymorphism harboring the SUL1 locus detected via whole genome sequencing. A) Circular binary segmentation of sequencing-depth ratios between evolved and parental genomes using DNAcopy. Gray dots represent the per nucleotide read-depth in the genome sequencing data. Segmentation-derived regions of equal copy number are indicated in red, smoothed by removing segments < 3× standard deviation apart. Segmentation defines a ~11 kb region with a 5.0× amplification and predicted breakpoints at chr2:784,043-795,080 (+/- 25 bp). The region of the sulfate permease SUL1 gene is shaded green. Blue lines indicate mappable positions in the reference genome. B) Array CGH data are shown for comparison. Tiling array data (gray dots) support a copy number amplification with breakpoints at 784009-795143 (+/- 50 nt). Blue line corresponds to the R runmed-smoothed trend in the data. A copy number estimate of 4.5× was obtained by comparative hybridization using ORF arrays (red lines). Tiling array hybridizations were optimized for SNP-calling and as such provide inaccurate copy number estimates.
Figure 3
Figure 3
Structural rearrangement and breakpoint information in the amplification of the SUL1 locus. Top: Sequence reads from the evolved genome spanning the breakpoints of the chromosome 2 amplification (black and white arrow with red and green ends) are shown aligned to the wild-type genomic sequences at these termini. These reads support the presence of the wild-type sequences at the borders of the amplified segment: 'Evo L' (red) and 'Evo R' (green) ends. The positions of inverted repeats in the yeast genome are highlighted in white squares (with black arrow heads) with the corresponding coordinates from chromosome 2. Underlined bases in the right-end contigs and reads indicate positions where inverted repeats differ. Middle: Contigs of unmapped reads shown in red ('Evo I') and green ('Evo II') consist of chromosome 2 genomic sequences from the borders of amplification but contain an inversion breakpoint. Arrows indicate directionality of the subgenomic sequences composing these contigs. Black sequences correspond to the nearby inverted repeats in the reference genome. Coordinates of the regions of identity to the reference chromosome 2 are indicated below each contig. Left-end breakpoints ('Evo I') are composed of chr2: 784,010-784,035 and chr2: 784,028-784,060 subsequences inverted with a 7 nt overlap. Right-end breakpoints ('Evo II") are composed of chr2: 795,082-795,113 and chr2: 795,137-795,168 subsequences inverted with a 13 nt overlap. Bottom: Contig composition and the presence of reads spanning the wild-type sequences at the boundaries of the amplification support inverted rearrangements as the structure underlying the 5× amplification along chromosome 2.

Similar articles

Cited by

References

    1. Dunham MJ, Badrane H, Ferea T, Adams J, Brown PO, Rosenzweig F, Botstein D. Characteristic genome rearrangements in experimental evolution of Saccharomyces cerevisiae. Proc Natl Acad Sci. 2002;99:16144–16149. doi: 10.1073/pnas.242624799. - DOI - PMC - PubMed
    1. Herring C, Raghunathan A, Honisch C, Patel T, Applebee M, Joyce A, Albert T, Blattner F, Boom D Van Den, Cantor C, Palsson B. Comparative genome sequencing of Escherichia coli allows observation of bacterial evolution on a laboratory timescale. Nat Genet. 2006;38:1406–1412. doi: 10.1038/ng1906. - DOI - PubMed
    1. Gresham D, Ruderfer DM, Pratt SC, Schacherer J, Dunham MJ, Botstein D, Kruglyak L. Genome-wide detection of polymorphisms at nucleotide resolution with a single DNA microarray. Science. 2006;311:1932–1936. doi: 10.1126/science.1123726. - DOI - PubMed
    1. Gresham D, Desai M, Tucker C, Jenq H, Pai D, Ward A, Desevo C, Botstein D, Dunham M. The repertoire and dynamics of evolutionary adaptations to controlled nutrient-limited environments in yeast. PLoS Genet. 2008;4:e1000303. doi: 10.1371/journal.pgen.1000303. - DOI - PMC - PubMed
    1. Segre AV, Murray AW, Leu JY. High-resolution mutation mapping reveals parallel experimental evolution in yeast. PLoS Biol. 2006;4:e256. doi: 10.1371/journal.pbio.0040256. - DOI - PMC - PubMed

Publication types

LinkOut - more resources