. 2010 Apr 2;285(14):10291-9.
doi: 10.1074/jbc.M109.077990. Epub 2010 Feb 3.

Ligand-induced rearrangements of the GABA(B) receptor revealed by fluorescence resonance energy transfer

Affiliations

Ligand-induced rearrangements of the GABA(B) receptor revealed by fluorescence resonance energy transfer

Shinichi Matsushita et al. J Biol Chem. .

Abstract

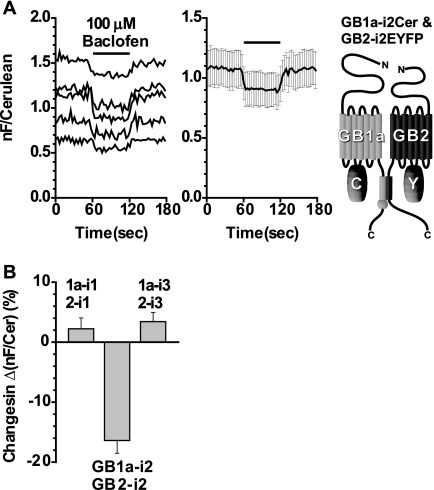
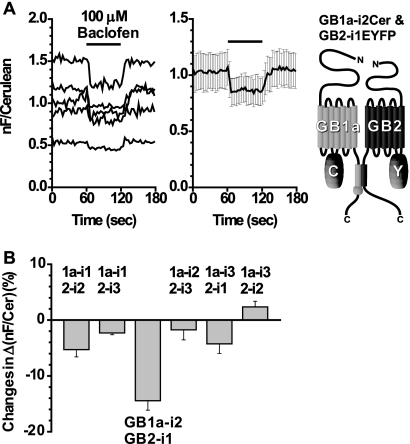
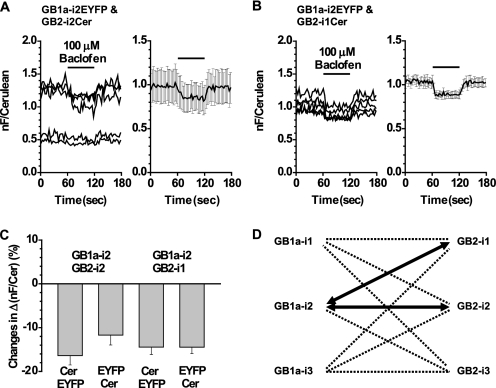
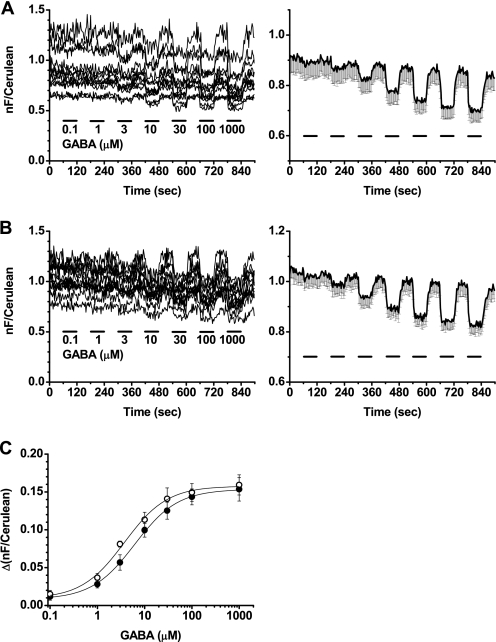
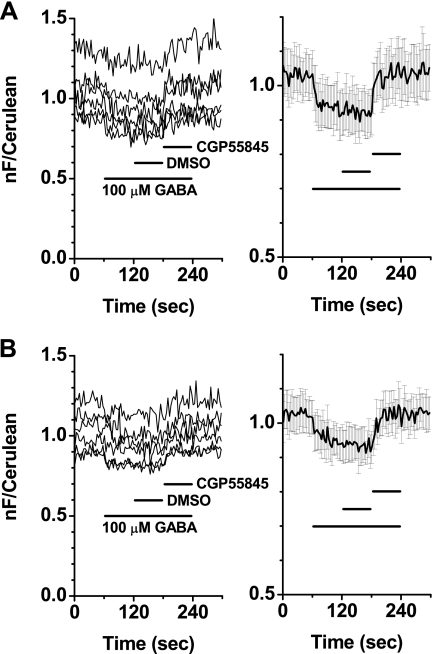
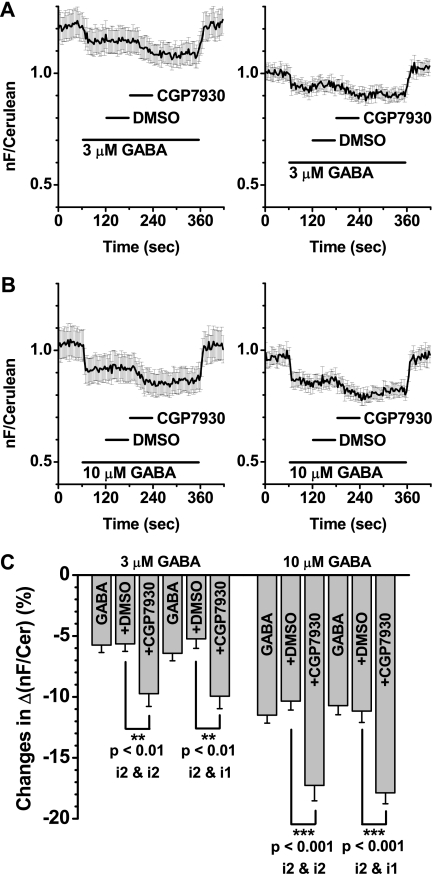
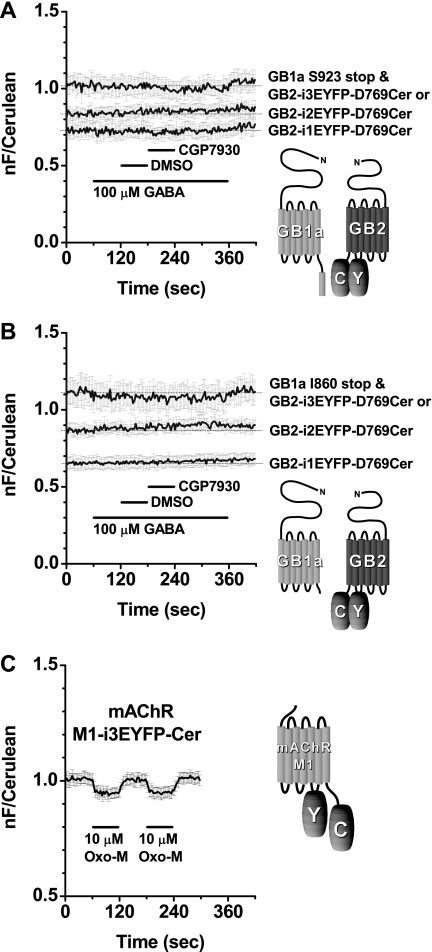
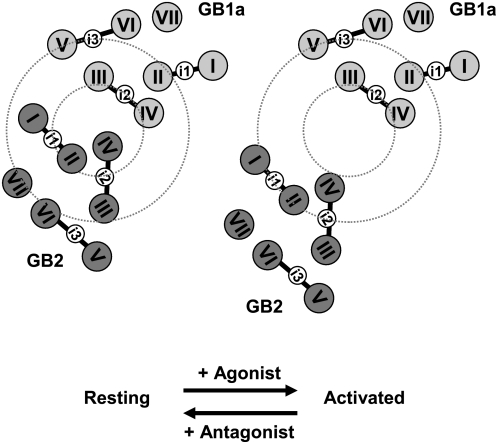
The gamma-aminobutyric acid type B receptor (GABA(B)R), one of the family C G-protein-coupled receptor members, exists as a heterodimer comprised of subunits GB1 and GB2. To clarify the ligand-induced activation mechanism of the GABA(B)R, each subunit was fused with either Cerulean or enhanced yellow fluorescent protein at its intracellular loop, and fluorescence resonance energy transfer (FRET) changes upon agonist application were monitored. As a result, FRET decreases were observed between GB1a loop 2 and GB2 loop 2 and between GB1a loop 2 and GB2 loop 1, suggesting the dissociation of intracellular domains during the receptor activation. Both intersubunit FRET pairs were expected to faithfully capture the activation of the original receptor as their pharmacological properties were highly similar to that of the wild-type receptor. However, the intrasubunit data suggest that the receptor activation does not involve major structural changes within the transmembrane domain of each subunit. By combining the results obtained from two different levels, it was concluded that the GABA(B)R activation by agonist is associated with an asymmetrical intersubunit rearrangement of GB1a and GB2 on the membrane. This type of activation mode, an intersubunit rearrangement without apparent intrahelical structural changes, appears commonly shared by the GABA(B)R and the metabotropic glutamate receptor 1alpha, another family C G-protein-coupled receptor previously studied by our group. Nevertheless, the directions of intracellular domain movements and its asymmetry observed here highlight the qualitative difference between the two receptors.


Figures

FIGURE 1.
FIGURE 1.
FRET between the GB1a and GB2 intracellular loops at the same position. A, left, the GB1a-i2Cer and GB2-i2EYFP pair displayed a FRET decrease by applying baclofen. Hereafter, all FRET changes were calculated by nF/Cerulean = (IFRET − (ICerulean × 0.37))/ICerulean (where nF is net FRET). After recording base line for 60 s, 100 μm baclofen was applied for 60 s (black bar) and washed for another 60 s. Each trace represents recording from a single cell. Middle, plots of means ± S.E. (n = 5). Right, schematic drawing of the GB1a-i2Cer and GB2-i2EYFP pair. B, bar graphs summarizing FRET changes in Δ(nF/Cerulean) (%). These were calculated by dividing the averaged amount of evoked changes (eight time points during 80–100 s) by the averaged base lines (eight time points during 20–40 s). Among three available combinations, only the GB1a-i2Cer and GB2-i2EYFP pair exhibited a FRET change that was more than 10%. From left to right: GB1a-i1Cer and GB2-i1EYFP (n = 5), GB1a-i2Cer and GB2-i2EYFP (n = 5), and GB1a-i3Cer and GB2-i3EYFP (n = 4).
FIGURE 2.
FIGURE 2.
FRET between the GB1a and GB2 intracellular loops with diagonal relationships. A, left, the GB1a-i2Cer and GB2-i1EYFP pair displayed a FRET decrease by applying baclofen. Application profile was the same as in Fig. 1. Middle, plots are means ± S.E. (n = 5). Right, schematic drawing of the GB1a-i2Cer and GB2-i1EYFP pair. B, bar graphs summarizing FRET changes in Δ(nF/Cerulean) (%) (where nF is net FRET). Among the six possible combinations, only the GB1a-i2Cer and GB2-i1EYFP pair exhibited a FRET change that was more than 10%. From left to right: GB1a-i1Cer and GB2-i2EYFP (n = 5), GB1a-i1Cer and GB2-i3EYFP (n = 5), GB1a-i2Cer and GB2-i1EYFP (n = 5), GB1a-i2Cer and GB2-i3EYFP (n = 5), GB1a-i3Cer and GB2-i1EYFP (n = 3), and GB1a-i3Cer and GB2-i2EYFP (n = 5).
FIGURE 3.
FIGURE 3.
Swapping fluorescent proteins in the two positive pairs displayed FRET decreases with similar amounts. A, left, FRET changes (nF/Cerulean, where nF is net FRET) from the GB1a-i2EYFP and GB2-i2Cer pair. Application profile was the same as in Fig. 1. Right, plots of mean ± S.E. (n = 5). B, left, FRET changes from the GB1a-i2EYFP and GB2-i1Cer pair. Right, plots of mean ± S.E. (n = 5). C, bar graphs representing the normalized FRET decreases (%) from the four pairs. D, intersubunit FRET revealed an asymmetric movement between the intracellular loops of GB1a and GB2. Loops connected by thick arrows represent the two positive pairs.
FIGURE 4.
FIGURE 4.
Concentration-response curves obtained from FRET changes of the GB1a-i2 and GB2-i2 and the GB1a-i2 and GB2-i1 pairs. A, GB1a-i2Cer and GB2-i2EYFP pair. Left, individual FRET traces upon incrementally elevated GABA applications (from 0.1 to 1000 μm). GABA was applied for 60 s and washed for 60 s each time. Right, plots of mean with only minus component of S.E. for easy recognition (n = 12). B, GB1a-i2Cer and GB2-i1EYFP pair. Left, individual FRET traces upon incrementally elevated GABA applications as in A. Right, plots of mean with only minus component of S.E. (n = 12). C, concentration-response curves derived from the individual traces. Filled circles, GB1a-i2Cer and GB2-i2EYFP pair, EC50 = 6.2 ± 0.4 μm; open circles, GB1a-i2Cer and GB2-i1EYFP pair, EC50 = 3.7 ± 0.6 μm. nF, net FRET.
FIGURE 5.
FIGURE 5.
FRET changes of the GB1a-i2 and GB2-i2 and the GB1a-i2 and GB2-i1 pairs were blocked by the GABAB receptor antagonist CGP55845. A, blockade of FRET decreases in the GB1a-i2EYFP and GB2-i2Cer. Left, individual traces; right, plots of mean ± S.E. (n = 6). B, blockade of FRET decreases in the GB1a-i2EYFP and GB2-i1Cer. Left, individual traces; right, plots of mean ± S.E. (n = 6). 100 μm GABA was applied for 180 s (long black bar). DMSO as a vehicle was added for 60 s (short black bar), followed by 5 μm CGP55845 with the same duration (short black bar). nF, net FRET.
FIGURE 6.
FIGURE 6.
Positive allosteric modulator CGP7930 potentiated the FRET decreases from the GB1a-i2 and GB2-i2 and the GB1a-i2 and GB2-i1 pairs. A, FRET responses of the GB1a-i2EYFP and GB2-i2Cer pair (left, plots of mean ± S.E., n = 12) and GB1a-i2EYFP and GB2-i1Cer pair (right, plots of mean ± S.E., n = 10) evoked by 3 μm GABA. GABA was applied for 300 s (long black bar). Within this period, DMSO was added as a vehicle for 60 s (short black bar), followed by 100 μm CGP7930 for 60 s (short black bar). Note the FRET decreases first evoked by GABA were further enhanced by CGP7930. B, FRET responses of the GB1a-i2EYFP and GB2-i2Cer pair (left, plots of mean ± S.E., n = 10) and GB1a-i2EYFP and GB2-i1Cer pair (right, plots of mean ± S.E., n = 10) evoked by 10 μm GABA. Application profiles are the same as those in A. C, summary of FRET changes shown in A and B. The y axis represents changes in Δ(nF/Cerulean). Bars represent the normalized FRET decreases by 3 or 10 μm GABA only, + DMSO, and + 100 μm CGP7930 applications. nF, net FRET.
FIGURE 7.
FIGURE 7.
GB2 intrasubunit FRET. A, three types of GB2, having Cerulean fixed at Asp769 and EYFP at one of different intracellular loops, paired with GB1a Ser923 stop mutant. No sign of response to GABA or when the agonist was coapplied with CGP7930. Plots of mean ± S.E. of individual recordings from GB1a Ser923 stop and GB2-i1EYFP-D769Cer (n = 8), GB2-i2EYFP-D769Cer (n = 7), or GB2-i3EYFP-D769Cer (n = 7) are shown. Application profile was the same as in Fig. 6. Hereafter, thin horizontal lines indicate the initial base-line levels. Schematic drawing of GB1a Ser923 stop and GB2-i3EYFP-D769Cer is shown on the right as a representative. B, three types of GB2, the same as shown in A, were paired with GB1a Ile860 stop mutant. No sign of response to GABA or when the agonist coapplied with CGP7930 except GB2-i3EYFP-D769Cer showing a subtle decrease while GABA was applied. Plots of mean ± S.E. of individual recordings from GB1a Ile860 stop and GB2-i1EYFP-D769Cer (n = 6) or GB2-i2EYFP-D769Cer (n = 4) or GB2-i3EYFP-D769Cer (n = 4) are shown. Application profile was the same as in Fig. 6. Schematic drawing of GB1a Ile860 stop and GB2-i3EYFP-D769Cer is shown on the right as a representative. C, mAChR M1 construct for detection of intrasubunit structural change exhibited agonist-induced FRET decrease. Left, plots of mean ± S.E., of individual FRET traces from M1-i3EYFP-Cer (n = 5). 10 μm oxotremorine M was applied for 60 s, washed for 60 s, and repeated again for checking the reproducibility. Right, schematic drawing of the M1 construct. nF, net FRET.
FIGURE 8.
FIGURE 8.
Scheme for the agonist-induced activation of the GABABR. A scheme representing the asymmetrical rearrangement of the subunits GB1a and GB2 upon agonist-induced activation. The 7TMD configuration is based on the cytoplasmic view of the rhodopsin crystal structure. Note that the activation involves dissociation of the two subunits, but the helical configuration of each subunit is kept unchanged. A small dotted circle denotes a region where the loops involved in large FRET decreases are positioned at the resting state. A large dotted circle demarcates a region where the nonresponding loops are placed at the resting state.

Similar articles

Cited by

References

    1. Bockaert J., Pin J. P. (1999) EMBO J. 18, 1723–1729 - PMC - PubMed
    1. Pin J. P., Galvez T., Prézeau L. (2003) Pharmacol. Ther. 98, 325–354 - PubMed
    1. Gether U., Asmar F., Meinild A. K., Rasmussen S. G. (2002) Pharmacol. Toxicol. 91, 304–312 - PubMed
    1. Schwartz T. W., Frimurer T. M., Holst B., Rosenkilde M. M., Elling C. E. (2006) Annu. Rev. Pharmacol. Toxicol. 46, 481–519 - PubMed
    1. Wess J., Han S. J., Kim S. K., Jacobson K. A., Li J. H. (2008) Trends Pharmacol. Sci. 29, 616–625 - PMC - PubMed

Publication types