. 2010 Mar 15;26(6):730-6.
doi: 10.1093/bioinformatics/btq040. Epub 2010 Feb 3.

SNVMix: predicting single nucleotide variants from next-generation sequencing of tumors

Affiliations

SNVMix: predicting single nucleotide variants from next-generation sequencing of tumors

Rodrigo Goya et al. Bioinformatics. .

Abstract

Motivation: Next-generation sequencing (NGS) has enabled whole genome and transcriptome single nucleotide variant (SNV) discovery in cancer. NGS produces millions of short sequence reads that, once aligned to a reference genome sequence, can be interpreted for the presence of SNVs. Although tools exist for SNV discovery from NGS data, none are specifically suited to work with data from tumors, where altered ploidy and tumor cellularity impact the statistical expectations of SNV discovery.

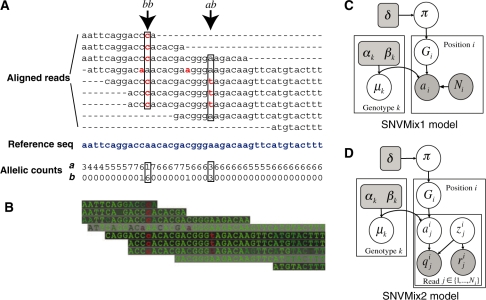
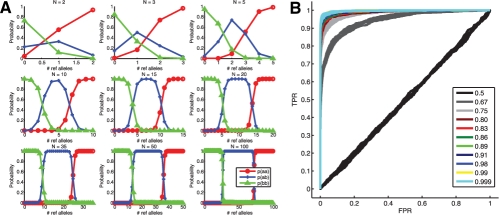
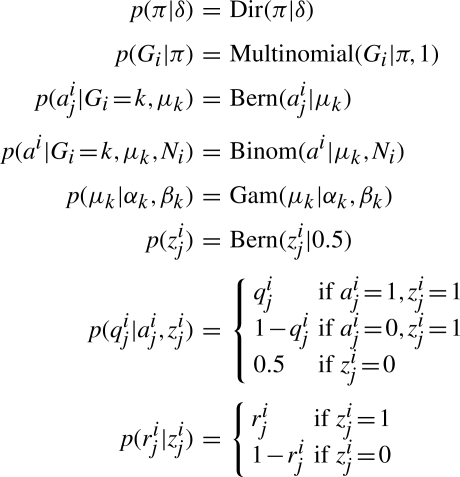
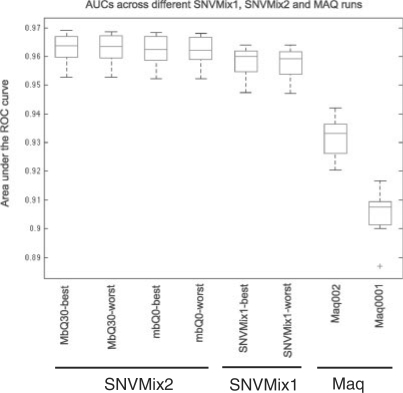
Results: We developed three implementations of a probabilistic Binomial mixture model, called SNVMix, designed to infer SNVs from NGS data from tumors to address this problem. The first models allelic counts as observations and infers SNVs and model parameters using an expectation maximization (EM) algorithm and is therefore capable of adjusting to deviation of allelic frequencies inherent in genomically unstable tumor genomes. The second models nucleotide and mapping qualities of the reads by probabilistically weighting the contribution of a read/nucleotide to the inference of a SNV based on the confidence we have in the base call and the read alignment. The third combines filtering out low-quality data in addition to probabilistic weighting of the qualities. We quantitatively evaluated these approaches on 16 ovarian cancer RNASeq datasets with matched genotyping arrays and a human breast cancer genome sequenced to >40x (haploid) coverage with ground truth data and show systematically that the SNVMix models outperform competing approaches.

Availability: Software and data are available at http://compbio.bccrc.ca

Contact: sshah@bccrc.ca SUPPLEMANTARY INFORMATION: Supplementary data are available at Bioinformatics online.


Figures

Fig. 1.
Fig. 1.
(A) Schematic diagram of input data to SNVMix1. We show how allelic counts (bottom) are derived from aligned reads (top). The reference sequence is shown indicated in blue. The arrows indicate positions representing SNVs. The non-reference bases are shown in red. (B) Input data for SNVMix2 that consists of the mapping and base qualities. The darker the background for a read represents a higher quality alignment. The brighter colored nucleotides represent higher quality base calls. Therefore, high contrast nucleotides are more trustworthy than lower contrast nucleotides. (C) SNVMix1 shown as a probabilistic graphical model. Circles represent random variables, and rounded squares represent fixed constants. Shaded notes indicate observed data [the allelic counts and the read depth from (A)]. Unshaded nodes indicate quantities that are inferred during EM. Gi∈{aa, ab, bb} represents the genotype, Ni∈{0, 1,…,} is the number of reads and ai∈{0, 1,…, Ni} is the number of reference reads. π is the prior over genotypes and μk is the genotype-specific Binomial parameter for genotype k. (D) SNVMix2 shown as a probabilistic graphical model. In comparison to SNVMix1, ai is unobserved and we expand the input to consider read-specific information indexed by j where zij=1 indicates that read j is correctly aligned, qij is the base quality and rij is the mapping quality.
Fig. 2.
Fig. 2.
(A) Theoretical behavior of SNVmix at depths of 2, 3, 5, 10, 15, 20, 35, 50 and 100. The plots show how the distribution of marginal probabilities changes with the number of reference alleles given the model parameters fit to a 10× breast cancer genome dataset. (B) ROC curves from fitting SNVMix2 to synthetic data with increasing levels of certainty in the base call.
Fig. 3.
Fig. 3.
Conditional probability distributions of SNVMix model.
Fig. 4.
Fig. 4.
Distribution of AUC over 16 ovarian cancer transcriptomes comparing accuracy of SNV detection for two Maq runs, the best and worst SNVMix1 runs in the cross-validation experiment (middle) and best and worst runs for SNVMix2 (mbQ0 = no quality thresholding, MbQ30 = keeping only reads with mapping qualities > Q30). SNVMix1 and SNVMix2 runs were statistically more accurate than both Maq runs (ANOVA, P < 0.0001). SNVMix2 runs were better than SNVMix1, but not statistically significantly.

Similar articles

Cited by

References

    1. Jones S, et al. Core signaling pathways in human pancreatic cancers revealed by global genomic analyses. Science. 2008;321:1801–1806. - PMC - PubMed
    1. Langmead B, et al. Ultrafast and memory-efficient alignment of short DNA sequences to the human genome. Genome Biol. 2009;10:R25. - PMC - PubMed
    1. Ley TJ, et al. DNA sequencing of a cytogenetically normal acute myeloid leukaemia genome. Nature. 2008;456:66–72. - PMC - PubMed
    1. Li H, et al. Mapping short DNA sequencing reads and calling variants using mapping quality scores. Genome Res. 2008;18:1851–1858. - PMC - PubMed
    1. Li H, Durbin R. Fast and accurate short read alignment with Burrows-Wheeler transform. Bioinformatics. 2009;25:1754–1760. - PMC - PubMed

Publication types