

Impact of varicella-zoster virus on dendritic cell subsets in human skin during natural infection
- PMID: 20130046
- PMCID: PMC2849518
- DOI: 10.1128/JVI.01450-09
Impact of varicella-zoster virus on dendritic cell subsets in human skin during natural infection
Abstract
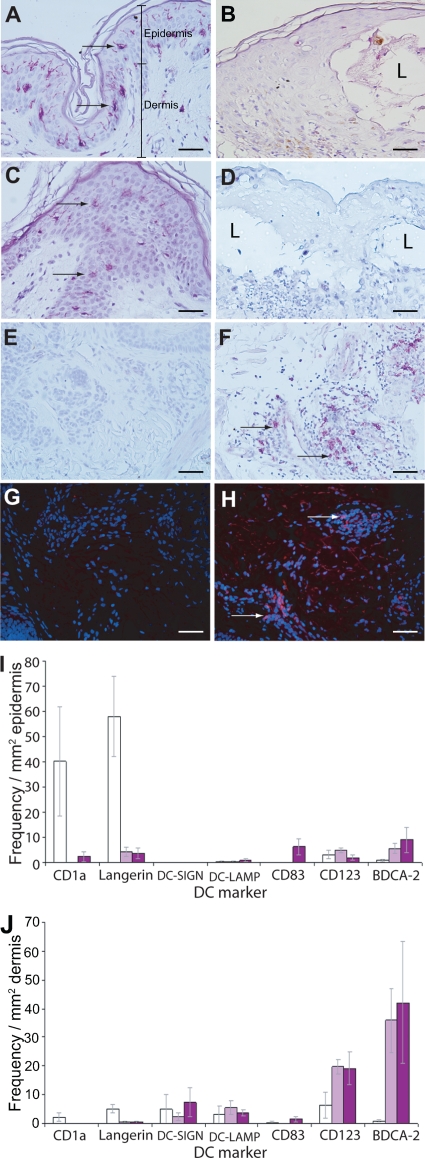
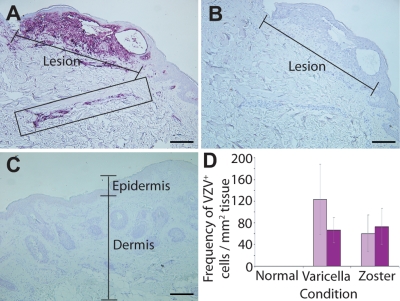
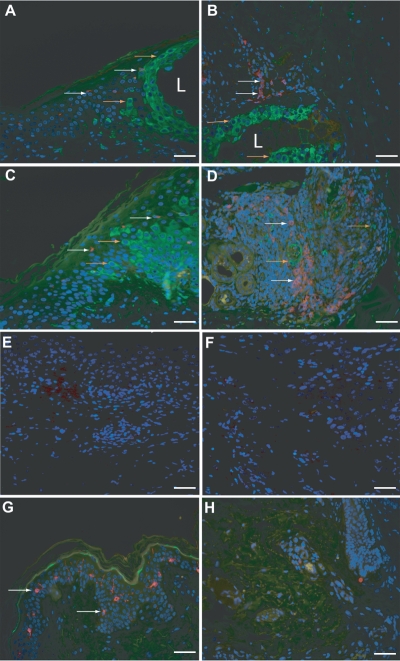
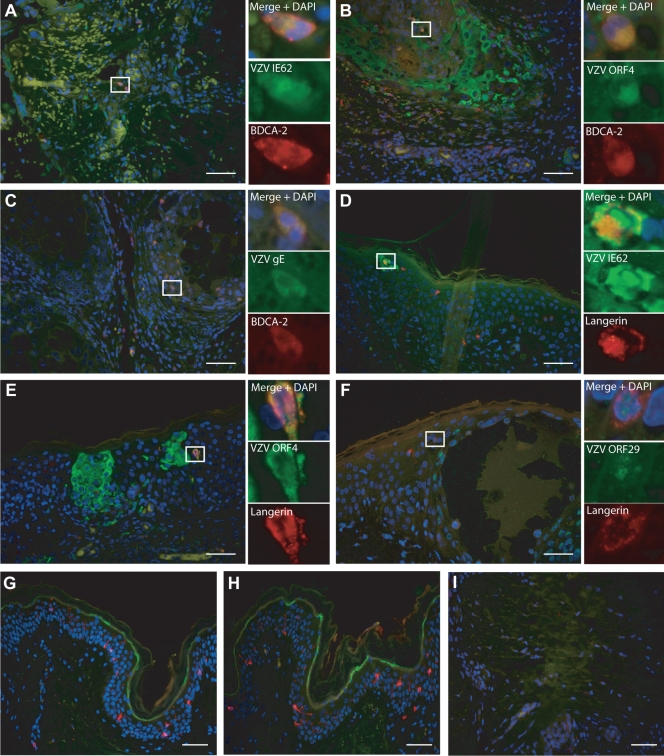
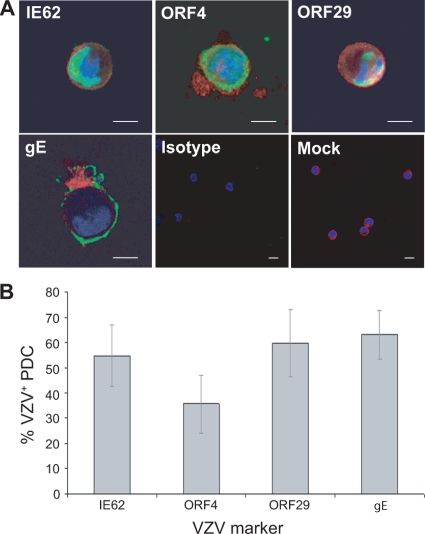
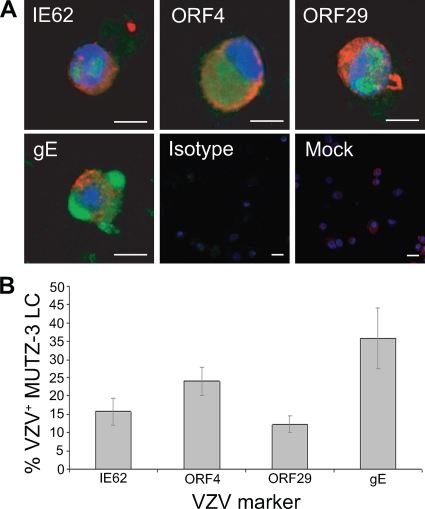
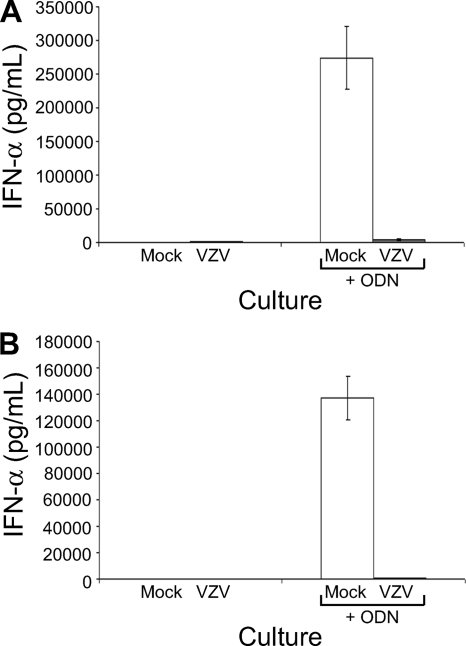
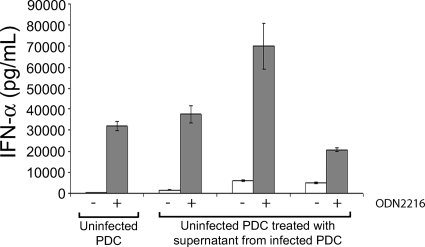
Varicella-zoster virus (VZV) causes varicella and herpes zoster, diseases characterized by distinct cutaneous rashes. Dendritic cells (DC) are essential for inducing antiviral immune responses; however, the contribution of DC subsets to immune control during natural cutaneous VZV infection has not been investigated. Immunostaining showed that compared to normal skin, the proportion of cells expressing DC-SIGN (a dermal DC marker) or DC-LAMP and CD83 (mature DC markers) were not significantly altered in infected skin. In contrast, the frequency of Langerhans cells was significantly decreased in VZV-infected skin, whereas there was an influx of plasmacytoid DC, a potent secretor of type I interferon (IFN). Langerhans cells and plasmacytoid DC in infected skin were closely associated with VZV antigen-positive cells, and some Langerhans cells and plasmacytoid DC were VZV antigen positive. To extend these in vivo observations, both plasmacytoid DC (PDC) isolated from human blood and Langerhans cells derived from MUTZ-3 cells were shown to be permissive to VZV infection. In VZV-infected PDC cultures, significant induction of alpha IFN (IFN-alpha) did not occur, indicating the VZV inhibits the capacity of PDC to induce expression of this host defense cytokine. This study defines changes in the response of DC which occur during cutaneous VZV infection and implicates infection of DC subtypes in VZV pathogenesis.
Figures
Similar articles
-
Varicella zoster virus immune evasion strategies.Curr Top Microbiol Immunol. 2010;342:155-71. doi: 10.1007/82_2010_41. Curr Top Microbiol Immunol. 2010. PMID: 20563710 Free PMC article. Review.
-
Expression of C-type lectin receptors by subsets of dendritic cells in human skin.Int Immunol. 2004 Jun;16(6):877-87. doi: 10.1093/intimm/dxh088. Epub 2004 Apr 27. Int Immunol. 2004. PMID: 15113774
-
Varicella-zoster virus transfer to skin by T Cells and modulation of viral replication by epidermal cell interferon-alpha.J Exp Med. 2004 Oct 4;200(7):917-25. doi: 10.1084/jem.20040634. Epub 2004 Sep 27. J Exp Med. 2004. PMID: 15452178 Free PMC article.
-
Modulation of major histocompatibility class II protein expression by varicella-zoster virus.J Virol. 2000 Feb;74(4):1900-7. doi: 10.1128/jvi.74.4.1900-1907.2000. J Virol. 2000. PMID: 10644363 Free PMC article.
-
Varicella-zoster virus T cell tropism and the pathogenesis of skin infection.Curr Top Microbiol Immunol. 2010;342:189-209. doi: 10.1007/82_2010_29. Curr Top Microbiol Immunol. 2010. PMID: 20397071 Free PMC article. Review.
Cited by
-
Varicella zoster virus immune evasion strategies.Curr Top Microbiol Immunol. 2010;342:155-71. doi: 10.1007/82_2010_41. Curr Top Microbiol Immunol. 2010. PMID: 20563710 Free PMC article. Review.
-
Simian Varicella Virus Pathogenesis in Skin during Varicella and Zoster.Viruses. 2022 May 27;14(6):1167. doi: 10.3390/v14061167. Viruses. 2022. PMID: 35746639 Free PMC article.
-
Molecular mechanisms of varicella zoster virus pathogenesis.Nat Rev Microbiol. 2014 Mar;12(3):197-210. doi: 10.1038/nrmicro3215. Epub 2014 Feb 10. Nat Rev Microbiol. 2014. PMID: 24509782 Free PMC article. Review.
-
Animal models of varicella zoster virus infection.Pathogens. 2013 May 13;2(2):364-82. doi: 10.3390/pathogens2020364. Pathogens. 2013. PMID: 25437040 Free PMC article. Review.
-
Varicella zoster virus productively infects human natural killer cells and manipulates phenotype.PLoS Pathog. 2018 Apr 30;14(4):e1006999. doi: 10.1371/journal.ppat.1006999. eCollection 2018 Apr. PLoS Pathog. 2018. PMID: 29709039 Free PMC article.
References
-
- Annunziato, P., O. Lungu, A. Gershon, D. N. Silvers, P. LaRussa, and S. J. Silverstein. 1996. In situ hybridization detection of varicella zoster virus in paraffin-embedded skin biopsy samples. Clin. Diagn. Virol. 7:69-76. - PubMed
-
- Arvin, A. M., J. F. Moffat, and R. Redman. 1996. Varicella-zoster virus: aspects of pathogenesis and host response to natural infection and varicella vaccine. Adv. Virus Res. 46:263-309. - PubMed
-
- Begon, E., L. Michel, B. Flageul, I. Beaudoin, F. Jean-Louis, H. Bachelez, L. Dubertret, and P. Musette. 2007. Expression, subcellular localization and cytokinic modulation of Toll-like receptors (TLRs) in normal human keratinocytes: TLR2 up-regulation in psoriatic skin. Eur. J. Dermatol. 17:497-506. - PubMed
Publication types
MeSH terms
Substances
LinkOut - more resources
Full Text Sources
Other Literature Sources
Medical
