. 2010 Apr;84(8):3974-83.
doi: 10.1128/JVI.02078-09. Epub 2010 Feb 3.

Dynamics of influenza virus infection and pathology

Affiliations

Dynamics of influenza virus infection and pathology

Roberto A Saenz et al. J Virol. 2010 Apr.

Abstract

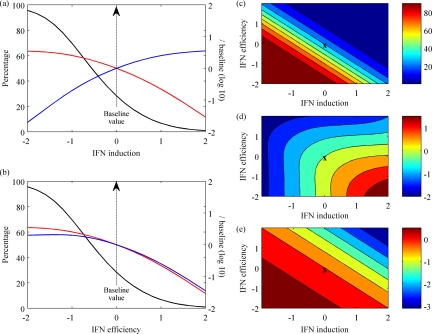
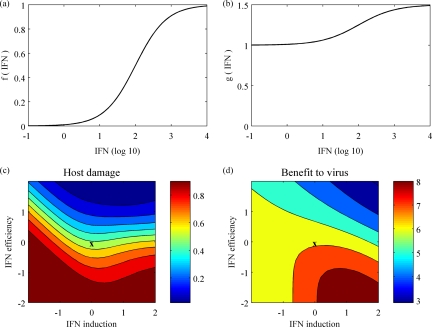
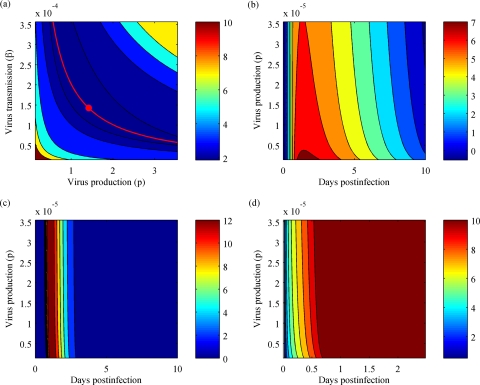
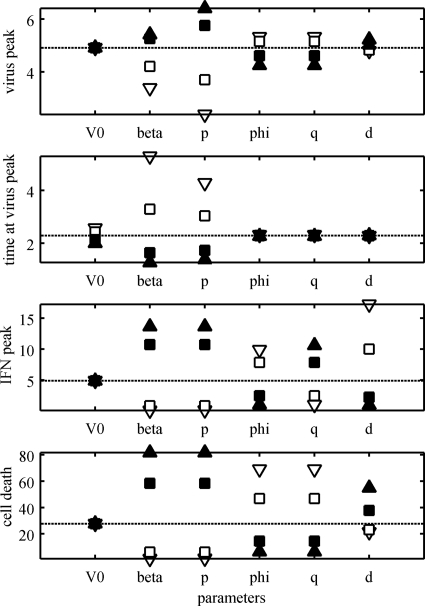
A key question in pandemic influenza is the relative roles of innate immunity and target cell depletion in limiting primary infection and modulating pathology. Here, we model these interactions using detailed data from equine influenza virus infection, combining viral and immune (type I interferon) kinetics with estimates of cell depletion. The resulting dynamics indicate a powerful role for innate immunity in controlling the rapid peak in virus shedding. As a corollary, cells are much less depleted than suggested by a model of human influenza based only on virus-shedding data. We then explore how differences in the influence of viral proteins on interferon kinetics can account for the observed spectrum of virus shedding, immune response, and influenza pathology. In particular, induction of high levels of interferon ("cytokine storms"), coupled with evasion of its effects, could lead to severe pathology, as hypothesized for some fatal cases of influenza.


Figures

FIG. 1.
FIG. 1.
Experimental data. (a to c) The numbers of uninfected (blue) and infected (red) respiratory epithelial cells were determined for each bronchiole in a left cranial lung sample from archived samples from an experimental infection of three immunologically naïve horses. The distribution of infection is shown for 2.5 (a), 4.5 (b), and 5.5 (c) days postinfection. The bronchioles were sorted in ascending order with respect to the number of epithelial cells they contained. (d) Total percentages of infection at 2.5, 4.5, and 5.5 days postinfection were determined to be 1.93%, 4.73%, and 1.87%, respectively (circles). A simple function (solid curve) was interpolated to these data points to estimate the cumulative percentage of cells infected over the course of infection (27%).
FIG. 2.
FIG. 2.
Diagram of the infection dynamics. Epithelial cells were classified into one of the following classes: susceptible (T), eclipse phase (E1 and E2), infectious (I), prerefractory (W), and refractory (R). Virus particles (V) are released by infectious cells, while interferon is secreted by infectious and eclipse phase (I and E2) cells.
FIG. 3.
FIG. 3.
Model dynamics. The innate-response model was fitted to individual virus shedding (RNA copies per milliliter of nasal secretion [NS]) and IFN (fold change) profiles of six immunologically naïve horses infected with A/equine/Kildare/89 (H3N8) virus (36) and to the estimated total cell death of 27%. (First and third rows) The virus shedding (red circles), IFN (blue triangles), and model output (solid and dashed curves, respectively) for each horse are shown. The minimum detection level for the virus load is drawn as a red horizontal line (negative results are plotted as zeros). (Second and fourth rows) Cell dynamics as predicted by the model (susceptible cells [T], dotted blue lines; infectious cells [I], dashed red lines; total numbers of epithelial cells, solid black lines). The purple triangles on the top right show the total percentages of cell death estimated in Fig. 1d.
FIG. 4.
FIG. 4.
Model dynamics; pooled data. The innate-response model was fitted to virus shedding and IFN responses of all six horses and to the estimated total cell death of 27%. (a) The virus shedding of each horse is drawn as a cross and the model output as a solid curve. The minimum detection level for the virus load is drawn as a horizontal line (negative results are plotted as zeros). (b) The IFN response (fold change) for each horse is given at each cross and the model output as a solid curve. (c) Cell dynamics as predicted by the model. Uninfected cells, T (dotted curve); infected cells, I (dashed line); and the total number of epithelial cells (solid curve) are shown. The triangle on the top right shows the total percentage of cell death estimated in Fig. 1d.
FIG. 5.
FIG. 5.
Spectrum of the immune response. (a and b) Both the total IFN produced (blue lines) and the peak virus load (red lines) were normalized to their baseline values and plotted on log base 10; cell death (black lines) is shown as a percentage. These values are all plotted against the rates of IFN induction per cell, q (a), or IFN efficiency, φ (b), both on a log scale normalized by their baseline values (average estimates from Table 2). (c to e) Contours plotted for various rates of IFN induction per cell, q, and IFN efficiency, φ, both on a log scale normalized by their baseline values (X marks the baseline values). Cell death (c) is shown as a percentage, while both total IFN produced (d) and the peak virus load (e) were normalized by baseline values and plotted on log base 10. The color scale on the right gives the values of this measure in each contour of the graph.
FIG. 6.
FIG. 6.
Host damage and benefit to the virus. (a) Relative damage of IFN to surviving cells (a logistic function between 0 and 1). (b) Relative increase in benefit for the virus as a function of IFN (a logistic function between 1 and 1.5). (c and d) Both host damage (c) and benefit to the virus (d), as defined in the text, are plotted as functions of IFN induction, q, and IFN efficiency, φ. Both axes are shown on a log scale normalized by baseline values. The color scales on the right give the values of these measures in each contour of the graphs.
FIG. A1.
FIG. A1.
Interdependence between virus-related estimates. (a) Contour plot of SSE as a function of β (virus transmission) and p (virus production per cell). The point (pmin, βmin) gives the minimum SSE (red circle). The hyperbolic curve is defined as follows: β × p = constant = βmin × pmin (red curve). (b to d) The contour plots for virus shedding (b) (in log scale), IFN production (c), and the abundance of refractory cells (d) are drawn as functions of p and time (days postinfection). β is defined as βmin × pmin/p [i.e., pairs (p, β) from the red curve in panel a]. The time scale (x axis) in panel d was cut short to 2.5 days, as the abundance of refractory cells was nearly constant beyond that point.
FIG. A2.
FIG. A2.
Sensitivity of the model parameters. The parameters V0, β, p, φ, q, and d were varied, one at a time, and the model dynamics were calculated. The virus peak, the time when the peak occurred, the IFN peak, and the total percentage of cell death are shown (the dotted lines show the dynamics at baseline values). The parameters were varied between 10−1 (open triangles), 10−0.5 (open squares), 100.5 (filled squares), and 101 (filled triangles) of their baseline values (average estimates from Table 2).
FIG. A3.
FIG. A3.
Sensitivity of the model parameters. The parameters k1, k2, δ, c, a, m, and n were varied, one at a time, and the model dynamics were calculated. The virus peak, the time when the peak occurred, the IFN peak, and the total percentage of cell death are shown (the dotted lines show the dynamics at baseline values). The parameters were varied between 0.5 (open triangles), 0.75 (open squares), 1.25 (filled squares), and 1.5 (filled triangles) of their baseline values (shown in Table 1).

Similar articles

Cited by

References

    1. Ada, G. L., and P. D. Jones. 1986. The immune response to influenza infection. Curr. Top. Microbiol. Immunol. 128:1-54. - PubMed
    1. Baccam, P., C. Beauchemin, C. A. Macken, F. G. Hayden, and A. S. Perelson. 2006. Kinetics of influenza A virus infection in humans. J. Virol. 80:7590-7599. - PMC - PubMed
    1. Basler, C. F., and P. V. Aguilar. 2008. Progress in identifying virulence determinants of the 1918 H1N1 and the Southeast Asian H5N1 influenza A viruses. Antiviral Res. 79:166-178. - PMC - PubMed
    1. Beauchemin, C., J. Samuel, and J. Tuszynski. 2005. A simple cellular automaton model for influenza A viral infections. J. Theor. Biol. 232:223-234. - PubMed
    1. Bocharov, G. A., and A. A. Romanyukha. 1994. Mathematical model of antiviral immune response. III. Influenza A virus infection. J. Theor. Biol. 167:323-360. - PubMed

Publication types

MeSH terms