. 2010 Apr 1;21(7):1293-304.
doi: 10.1091/mbc.e09-09-0767. Epub 2010 Feb 3.

The Na+/H+ exchanger NHE6 in the endosomal recycling system is involved in the development of apical bile canalicular surface domains in HepG2 cells

Affiliations

The Na+/H+ exchanger NHE6 in the endosomal recycling system is involved in the development of apical bile canalicular surface domains in HepG2 cells

Ryuichi Ohgaki et al. Mol Biol Cell. .

Abstract

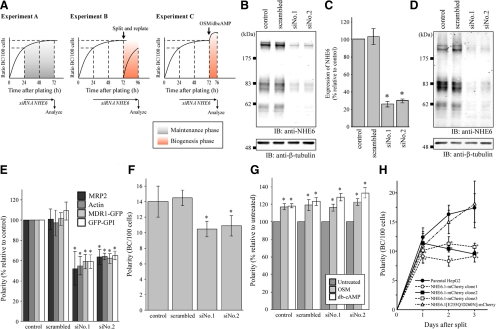
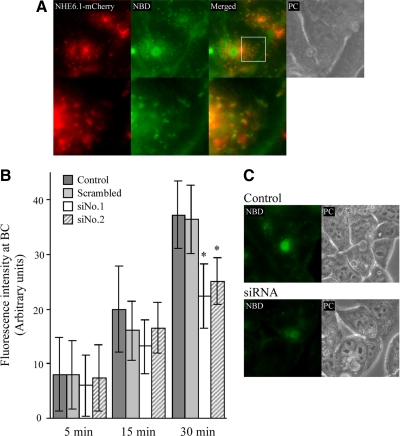
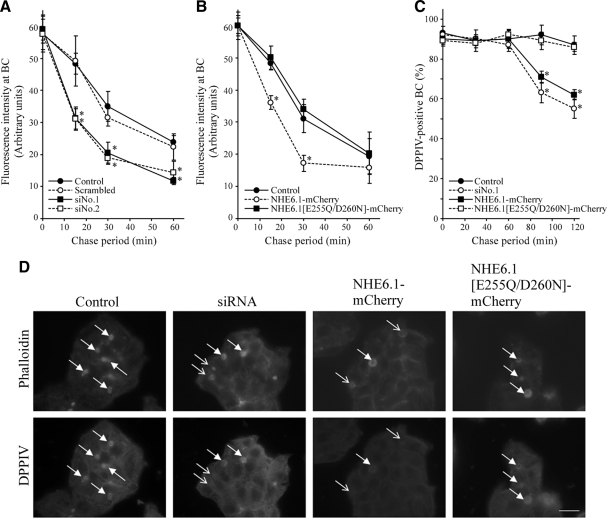
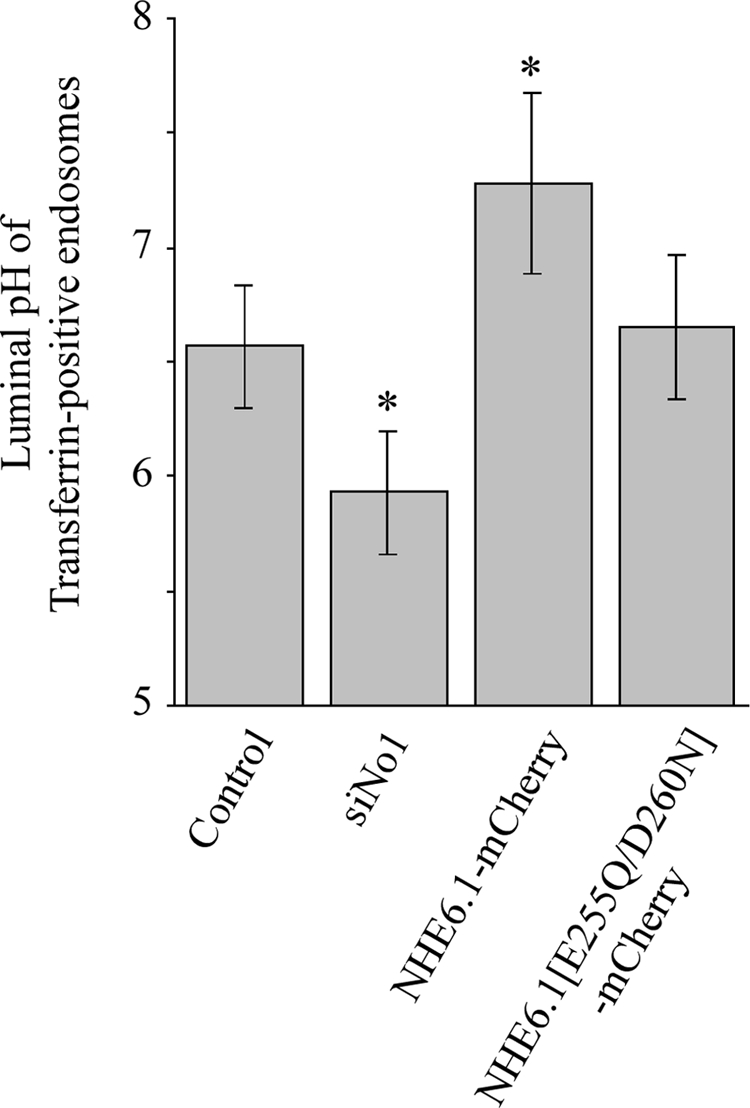
Polarized epithelial cells develop and maintain distinct apical and basolateral surface domains despite a continuous flux of membranes between these domains. The Na(+)/H(+)exchanger NHE6 localizes to endosomes but its function is unknown. Here, we demonstrate that polarized hepatoma HepG2 cells express an NHE6.1 variant that localizes to recycling endosomes and colocalizes with transcytosing bulk membrane lipids. NHE6.1 knockdown or overexpression decreases or increases recycling endosome pH, respectively, and inhibits the maintenance of apical, bile canalicular plasma membranes and, concomitantly, apical lumens. NHE6.1 knockdown or overexpression has little effect on the de novo biogenesis of apical surface domains. NHE6.1 knockdown does not inhibit basolateral-to-apical transcytosis of bulk membrane lipids, but it does promote their progressive loss from the apical surface, leaving cells unable to efficiently retain bulk membrane and bile canalicular proteins at the apical surface. The data suggest that a limited range of endosome pH mediated by NHE6.1 is important for securing the polarized distribution of membrane lipids at the apical surface and maintenance of apical bile canaliculi in HepG2 cells and hence cell polarity. This study underscores the emerging role of the endosomal recycling system in apical surface development and identifies NHE6 as a novel regulatory protein in this process.


Figures

Figure 1.
Figure 1.
Endogenous expression and novel N-glycosylated state of NHE6.1 in HepG2 cells. Endogenous NHE6 expressed in HepG2 was detected by immunoblotting with anti-NHE6 antibody. For comparison of the apparent molecular size on the SDS-PAGE gel, one of two NHE6 variants, NHE6.0 or NHE6.1, was transiently expressed in COS-7 cells. Untransfected cells were used as a negative control (Mock). Lysate of HepG2 cells was loaded 10 μg of protein per lane, whereas COS-7 lysates were diluted to 50-fold (0.2 μg protein/lane). Before the separation by SDS-PAGE, samples were incubated at 37°C for 1 h in the absence (left) or the presence of PNGase F (right). Immunoreactive NHE6 bands are indicated with small letters with bars.
Figure 2.
Figure 2.
Subcellular localization of NHE6.1 in HepG2 cells. Localization of NHE6.1 in HepG2 cells was characterized by immunofluorescence confocal microscopy after fixation with 4% PFA. (A) Cells were transiently transfected with Rab11a-GFP (green), and stained for endogenous NHE6 (red) with either MRP2 or EEA1 (blue). (B) NHE6-EGFP (green) was transiently expressed in HepG2 cells. Cells were stained for endogenous Rab11a (red) with either MRP2 or EEA1 (blue). (C) Cells were stained for endogenous NHE6 (green), F-actin (red), and LAMP-1 (blue). (D) Cells transiently expressing NHE6-EGFP (green) were stained for F-actin (red) and Giantin (blue). Antibodies used for the detection of endogenous proteins are described in the Materials and Methods. For the staining of F-actin, TRITC-labeled phalloidin was used. The shape of cells was identified by differential interference contrast images and indicated with broken lines. Bars, 10 μm.
Figure 3.
Figure 3.
Localization of NHE6.1 in SAC. HepG2 cells stably expressing NHE6.1-mCherry (red) were labeled with 4 μM C6-NBD-GlcCer or C6-NBD-SM (green) at 37°C for 30 min. Subsequently, fluorescent lipid analogue remaining in the basolateral membrane was removed by back exchange method with 5% BSA on ice. Cells were further incubated at 18°C for 60 min to induce accumulation of the lipid analogue at SAC. To selectively quench the fluorescence at BC, cells were incubated with 30 mM sodiumdithionite at 4°C for 7 min [sodium dithionite (+)]. As a control, cells were treated with HBSS at the same condition [sodium dithionite (−)]. Cells were directly subjected to observation by microscope under live condition. Merged fluorescent images and phase contrast images are also shown (Merged and PC, respectively).
Figure 4.
Figure 4.
Segregation of NHE6.1 from EEA1-positve early endosomes during SAC visualization. The procedure of SAC visualization described in Figure 3 was followed with NHE6.1-mCherry stable cells (top) and normal HepG2 cells (bottom), except that fluorescent lipid analogue was omitted from the solution. Cells were then fixed and investigated by immunostaining. In stable cells, the localization of NHE6.1-mCherry was identified by its fluorescence (red), and compared with the localization of Ezrin (green) and EEA1 (blue). Normal HepG2 cells were stained for F-anctin (red), NHE6 (green) and EEA1 (blue). The shape of cells was confirmed by differential interference contrast images and indicated with broken lines. Bar, 10 μm.
Figure 5.
Figure 5.
Effect of altered NHE6.1 expression on the development of apical lumens during the maintenance- and biogenesis phase. (A) Schematic procedure of sample preparation and analysis. In experiment A, cells were transfected with either of two siRNAs against human NHE6.1 or scrambled siRNA 24 h after plating and analyzed 48 h later (maintenance phase). In experiment B, siRNA-treated cells as described in experiment A were subsequently detached from the substratum with trypsin and the calcium chelator EDTA (a procedure that destroys all existing apical lumens), replated, and analyzed 24 h later (biogenesis phase). In experiment C, siRNA-treated cells as described in experiment A were subsequently stimulated with OSM (10 ng/ml) or db-cAMP (1 mM) at 37°C for 4 h (biogenesis phase). (B) Samples were prepared as described in experiment A, and the expression of NHE6.1 (top) and β-tubulin (bottom) was analyzed by Western blotting. (C) The intensity of immunoreactive bands in B was quantified as described under Materials and Methods. The relative amount of expression was calculated as percentage relative to control. The data shown are the average of five independent experiments ± SD. *p < 0.05 in unpaired Student's t test. (D) Cells were prepared as described in experiment B, and expression of NHE6.1 (top) and β-tubulin (bottom) was analyzed by immunoblotting. (E) Knockdown of NHE6.1 was conducted as described in experiment A. Forty-eight hours after transfection, cells were fixed and stained for apical BC membrane markers: MRP2, F-actin, MDR1-GFP, and GFP-GPI. Staining for F-actin was performed with normal HepG2 cells, whereas the fluorescence of GFP of stable transformants was used for MDR1-GFP and GFP-GPI. Polarity of cells, expressed as BC/100 cells, was determined and shown as percentage relative to untreated control cells. The data shown are the average of four independent experiments ± SD, *p < 0.05 in unpaired Student's t test. (F) Knockdown of NHE6.1 was performed as described in experiment B. Forty-eight hours after transfection of siRNA, cells were split again and incubated for further 24 h. Then, cells were fixed, stained for MRP2, and subjected to the investigation of polarity (BC/100 cells). The data shown are the average of four independent experiments ± SD, *p < 0.05 in unpaired Student's t test. (G) Knockdown of NHE6.1 was performed as described in experiment C. Forty-eight hours after transfection, cells were treated with medium supplemented with OSM (10 ng/ml) (light gray bars) or db-cAMP (1 mM) (open bars) for 4 h and then fixed and stained for MRP2. The Polarity was investigated and shown as percentage relative to control cells treated with normal medium (dark gray bars). The data are expressed as the mean value of four independent experiments ± SD, *p < 0.05 in unpaired Student's t test. (H) Three stable clones of NHE6.1-mCherry and a stable clone of mutant NHE6.1-mCherry were established and isolated as described in Materials and Methods. From 1 d to 3 d after split, cells were fixed at every 24 h, and the polarity was evaluated by apical staining with MRP2 (BC/100 cells). The data are expressed as the mean value of four independent experiments ± SD, *p < 0.05 in unpaired Student's t test.
Figure 6.
Figure 6.
Colocalization of NHE6.1 with transcytosing lipids and effect of NHE6.1 knockdown on the kinetics of transcytosis. (A) HepG2 cells stably expressing NHE6.1-mCherry (red) were incubated with 4 μM C6-NBD-GlcCer (green) on ice for 15 min and incubated at 37°C for 15 min. The remaining basolateral pool of lipid analogue was removed on ice by a back-exchange procedure and cells were observed under live condition. Merged fluorescent images and phase contrast images are also shown (Merged and PC, respectively). Bottom, high magnification of the indicated area in top panels with a white square. (B) Knockdown of NHE6.1 was conducted as described in Figure 5. After incubation with 4 μM C6-NBD-GlcCer on ice for 15 min, cells were chased at 37°C for indicated periods (5, 15, and 30 min). Quantification of the NBD fluorescence at BC was performed as described in Materials and Methods (untreated control cells, dark gray bars; scrambled siRNA-treated cells, bright gray bars; NHE6.1 siRNA-treated cells, open bars and slashed bars). In a single experiment, in each sample, randomly selected 10 BCs were analyzed and the fluorescence intensity was averaged. Data are shown as mean ± SD of four independent experiments. *p < 0.05 in unpaired Student's t test. (C) Representative images of cells chased for 30 min were shown (untreated control cells, top; NHE6.1 siRNA-treated cells, bottom.
Figure 7.
Figure 7.
Effect of NHE6 knockdown on the fate of apically delivered C6-NBD-GlcCer and DPPIV. (A and B) After knockdown of NHE6 as described in Figure 5 (A) or overexpression of NHE6.1-mCherry or NHE6.1[E287Q/D292N]-mCherry (B), HepG2 cells were loaded with 4 μM C6-NBD-GlcCer at 37°C for 30 min. After back-exchange procedure on ice, cells were subsequently incubated in 5% BSA/HBSS, pH 7.4, at 37°C for indicated period. Quantification of the NBD fluorescence at BC was performed as described in Materials and Methods. In a single experiment, in each sample, randomly selected 10 BCs were analyzed and the fluorescence intensity was averaged. Data are shown as mean ± SD of four independent experiments. *p < 0.05 in unpaired Student's t test. (C) After knockdown of NHE6 as described in Figure 5 (A) or overexpression of NHE6.1-mCherry or NHE6.1[E287Q/D292N]-mCherry (B), anti-DPPIV antibodies were allowed to bind DPPIV at the basolateral surface and transcytose to the apical domain. The fate of apically delivered DPPIV was subsequently determined by a subsequent chase at 37°C for 30, 60, 90, or 120 min, as described in Materials and Methods. Data are shown as mean percentage of DPPIV-positive BC (±SD) of three independent experiments. (D) Fluorescent images showing the persistent localization of DPPIV in phalloidin-positive BC (filled arrows) and the loss of DPPIV signal from some phalloidin-labeled BC (empty arrows) in siRNA treated and NHE6.1-mCherry-overexpressing cells, after a 120-min chase period. Bar, 10 μm.
Figure 8.
Figure 8.
Effect of altered NHE6.1 expression on endosomal pH. Serum-starved cells that had been treated with siRNA against NHE6.1 or overexpressed wild-type or mutant NHE6.1-mCherry were incubated with a combination of pH-sensitive fluorescein-labeled transferrin and pH-stable Alexa Fluor546- or Alexa Fluor633-labeled transferrin to measure endosomal pH as described in Materials and Methods. Data are presented as mean ± SD.

Similar articles

Cited by

References

    1. Apodaca G., Katz L. A., Mostov K. E. Receptor-mediated transcytosis of IgA in MDCK cells is via apical recycling endosomes. J. Cell Biol. 1994;125:67–86. - PMC - PubMed
    1. Aniento F., Gu F., Parton R. G., Gruenberg J. An endosomal beta COP is involved in the pH-dependent formation of transport vesicles destined for late endosomes. J. Cell Biol. 1996;133:29–41. - PMC - PubMed
    1. Babia T., Kok J. W., van der Haar M., Kalicharan R., Hoekstra D. Transport of biosynthetic sphingolipids from Golgi to plasma membrane in HT29 cells: involvement of different carrier vesicle populations. Eur. J. Cell Biol. 1994;63:172–181. - PubMed
    1. Barr V. A., Hubbard A. L. Newly synthesized hepatocyte plasma membrane proteins are transported in transcytotic vesicles in the bile duct-ligated rat. Gastroenterology. 1993;105:554–571. - PubMed
    1. Barroso M., Sztul E. S. Basolateral to apical transcytosis in polarized cells is indirect and involves BFA and trimeric G protein sensitive passage through the apical endosome. J. Cell Biol. 1994;124:83–100. - PMC - PubMed

Publication types

LinkOut - more resources