. 2010 Apr 1;21(7):1166-77.
doi: 10.1091/mbc.e09-08-0689. Epub 2010 Feb 3.

Indole-3-carbinol triggers aryl hydrocarbon receptor-dependent estrogen receptor (ER)alpha protein degradation in breast cancer cells disrupting an ERalpha-GATA3 transcriptional cross-regulatory loop

Affiliations

Indole-3-carbinol triggers aryl hydrocarbon receptor-dependent estrogen receptor (ER)alpha protein degradation in breast cancer cells disrupting an ERalpha-GATA3 transcriptional cross-regulatory loop

Crystal N Marconett et al. Mol Biol Cell. .

Abstract

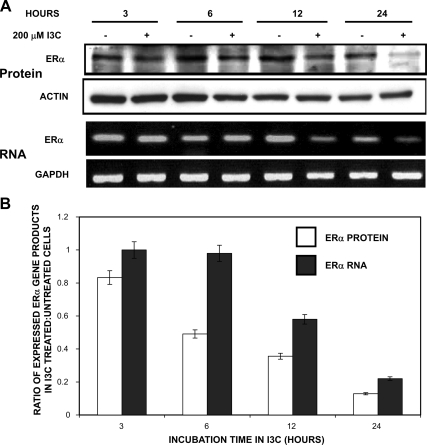
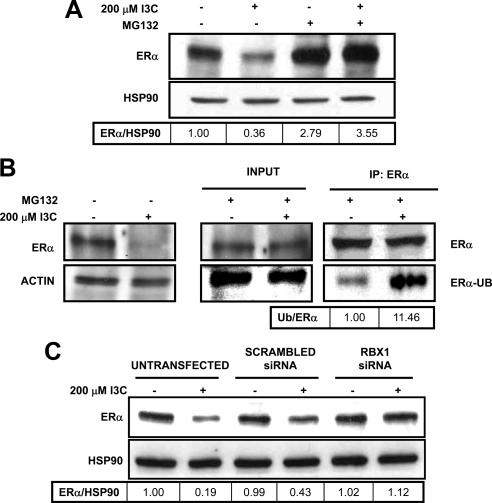
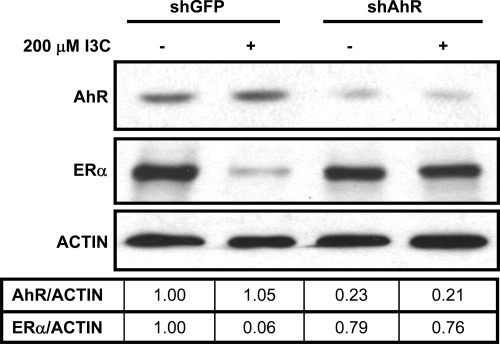
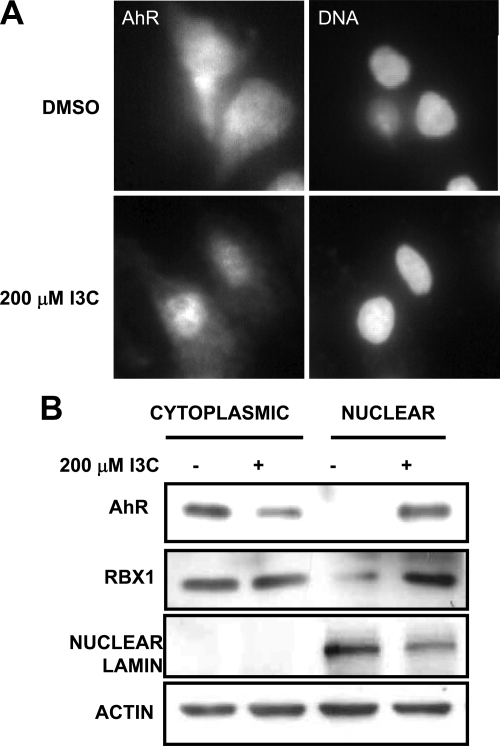
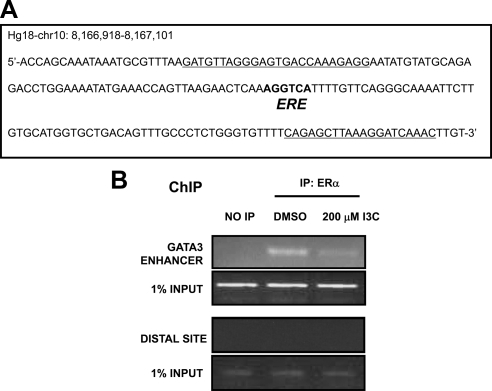
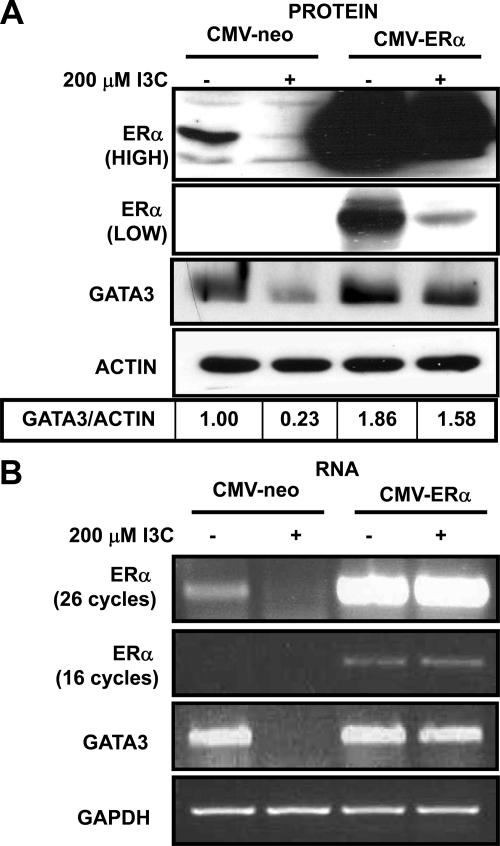
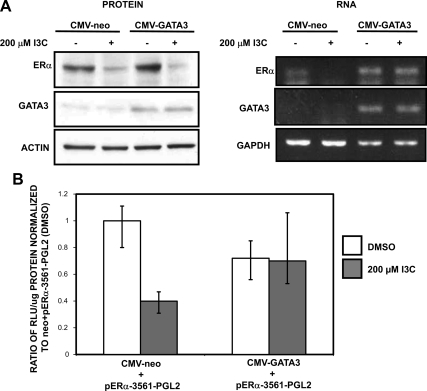
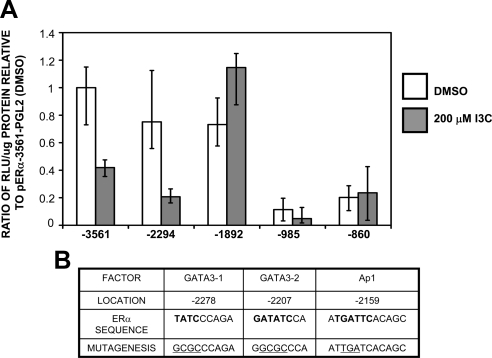
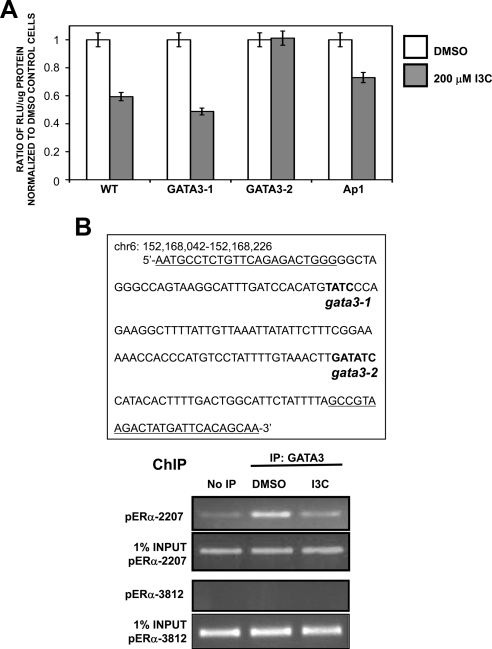
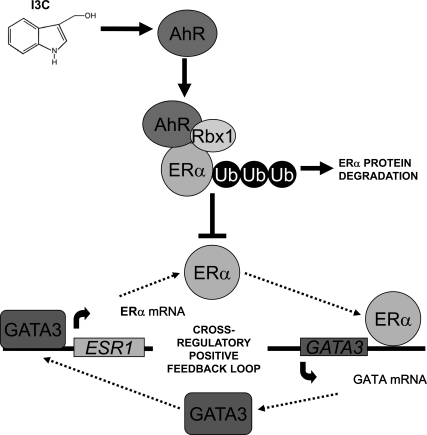
Estrogen receptor (ER)alpha is a critical target of therapeutic strategies to control the proliferation of hormone-dependent breast cancers. Preferred clinical options have significant adverse side effects that can lead to treatment resistance due to the persistence of active estrogen receptors. We have established the cellular mechanism by which indole-3-carbinol (I3C), a promising anticancer phytochemical from Brassica vegetables, ablates ERalpha expression, and we have uncovered a critical role for the GATA3 transcription factor in this indole-regulated cascade. I3C-dependent activation of the aryl hydrocarbon receptor (AhR) initiates Rbx-1 E3 ligase-mediated ubiquitination and proteasomal degradation of ERalpha protein. I3C inhibits endogenous binding of ERalpha with the 3'-enhancer region of GATA3 and disrupts endogenous GATA3 interactions with the ERalpha promoter, leading to a loss of GATA3 and ERalpha expression. Ectopic expression of GATA3 has no effect on I3C-induced ERalpha protein degradation but does prevent I3C inhibition of ERalpha promoter activity, demonstrating the importance of GATA3 in this I3C-triggered cascade. Our preclinical results implicate I3C as a novel anticancer agent in human cancers that coexpress ERalpha, GATA3, and AhR, a combination found in a large percentage of breast cancers but not in other critical ERalpha target tissues essential to patient health.


Figures

Figure 1.
Figure 1.
Effects of I3C on kinetics of ERα expression. (A) MCF-7 human breast cancer cells were treated with or without 200 μM I3C through a 24-h time course. At the indicated time points, the levels of ERα protein were monitored by Western blots and the levels of ERα transcripts determined by RT-PCR. Actin was used as protein loading control, and GAPDH was used as a RNA loading control. PCR products were visualized on a 1% agarose gel stained with ethidium bromide. (B) Levels of ERα protein and transcripts were quantified by densitometry of the Western blots and RT-PCR gels shown in A. This result was repeated three times, and a representative blot is shown. The bar graphs represent the ratio of ERα gene expression observed in I3C-treated versus untreated controls.
Figure 2.
Figure 2.
I3C induces the ubiquitination and 26S proteasome degradation of ERα protein and requirement of the Rbx1 E3 ubiquitin ligase this degradative process. (A) MCF-7 cells were treated with the indicated combinations of 200 μM I3C and 5 mM MG132 (a 26S proteasome inhibitor) for 6 h, and the level of ERα protein monitored by Western blots. HSP90 was used as gel loading control. A representative blot of three independent experiments is shown. (B) In MCF-7 cells were treated with the indicated combinations of 200 μM I3C and 5 mM MG132. Total cell extracts were immunoprecipitated with mouse-anti-ERα antibodies and electrophoretically fractionated samples blotted with either rabbit-anti-ERα or rabbit-anti-ubiquitin antibodies (ERα-UB). Result was repeated four times, representative blot shown. (C) MCF-7 cells were transfected with control scrambled siRNA or Rbx1-specific siRNA or remained untransfected for 24 h. Cells were then treated with or without 200 μM I3C for 6 h, and the level of ERα protein determined by Western blot analysis. Result was repeated twice. Densitometry numbers are the ratio of ERα to loading control, normalized to the DMSO ratio.
Figure 3.
Figure 3.
I3C-mediated degradation of ERα protein requires AhR. MCF-7 cells were transfected with shAhR or shGFP (control plasmid) and then treated with or without or 200 μM I3C for 6 h. Total cell extracts were electrophoretically fractionated and the levels of ERα, AhR, and actin (loading control) analyzed by Western blots. This result was repeated in three independent experiments. Densitometry numbers are the ratio of ERα to loading control, normalized to the DMSO ratio.
Figure 4.
Figure 4.
I3C induces the nuclear localization of AhR. (A) MCF-7 cells were treated with or without 200 μM I3C for 6 h, and the subcellular localization of AhR determined by indirect immunofluorescence microscopy. DAPI staining was used to visualize DNA stained nuclei (right). (B) MCF-7 cells treated with 200 μM I3C or with the DMSO (vehicle control) for 24 h, and cell extracts fractionated into cytoplasmic and nuclear fractions. Each set of subcellular fractions were electrophoretically fractionated and analyzed by Western blot for the levels of AhR, Rbx1, nuclear lamin (fractionation control), and actin (loading control) in each cellular compartment. The result was repeated in three independent experiments.
Figure 5.
Figure 5.
Effects of I3C on the expression of GATA3 protein and GATA3 transcripts. MCF-7 cells were treated with or without 200 μM I3C, and at the indicated times the level of GATA3 and ERα protein was monitored by Western blot analysis (top), and GATA3 and ERα transcript expression was determined by RT-PCR (bottom). The PCR products were visualized on a 1% agarose gel stained with ethidium bromide. HSP90 provided a loading control for the western blots and GAPDH provided a gel loading control for the RT-PCR. The results were repeated three times, and representative blots and gels are shown. Densitometry numbers are the ratio of ERα or GATA3 to loading control, normalized to the DMSO ratio.
Figure 6.
Figure 6.
I3C disrupts ERα protein interaction with GATA3 regulatory regions. (A) Genomic sequences of the GATA3 gene enhancer contain a consensus half-ERE site. Primers used to amplify ERE site for chromatin immunoprecipitation are underlined. Sequence and chromosomal location were obtained from the UCSC Genome Browser. (B) ChIP was used to characterize endogenous ERα interactions with the ERE region of the GATA3 enhancer region. Chromatin was isolated from MCF-7 cells treated with or without 200 μM I3C for 24 h. ERα was immunoprecipitated from total cell extracts using Sepharose G bound to anti-ERα antibody, and DNA released from ERα was amplified using the indicated oligonucleotide primers. Control primers directed at downstream site (distance, 1256 base pairs) showed no amplification in immunoprecipitated (IP) samples. Input samples represent total genomic DNA from each treatment (loading control). This result was repeated twice.
Figure 7.
Figure 7.
I3C down-regulation of GATA3 gene expression requires the I3C mediated loss of ERα protein. (A) MCF-7 cells were transfected with CMV-ERα or the CMV-Neo vector control and treated with or without 200 μM I3C for 48 h. Total Cell lysates were electrophoretically fractionated and analyzed by Western blots for the levels of GATA3, ERα, and actin (loading control) protein. (HIGH) and (LOW) designations refer to film exposure times of the blot. This result was repeated in three independent experiments. Densitometry numbers are the ratio of GATA3 to loading control, normalized to the DMSO ratio. (B) Total RNA was collected from MCF-7 cells treated with or without 200 μM I3C for 48 h, and RT-PCR was used to detect GATA3 and ERα transcripts. GAPDH was used as total RNA loading control. PCR products were visualized on a 1% agarose gel stained with ethidium bromide. This experiment was repeated twice.
Figure 8.
Figure 8.
The I3C inhibition of ERα transcripts levels requires the down-regulation of GATA3 gene expression. (A) MCF-7 cells were transfected with CMV-GATA3 or CMV-neo vector control and treated with or without 200 μM I3C for 48 h. Total Cell lysates were electrophoretically fractionated and analyzed by Western blots for the levels of GATA3, ERα, and actin (loading control) protein (left). Total RNA was collected from MCF-7 cells treated with or without 200 μM I3C for 24 h and RTPCR was used to detect GATA3 and ERα transcripts (right). GAPDH was used as total RNA loading control. PCR products were visualized on a 1% agarose gel stained with ethidium bromide. This result was repeated four times, and representative blots and gels are shown. (B) MCF-7 cells were cotransfected with the I3C-responsive −3561 base pairs fragment of the ERα promoter linked to a luciferase reporter plasmid along with either CMV-GATA3 or CMV-neo (vector control). At 24 h posttransfection, cells were treated with or without 200 μM I3C for 24 h, and the relative luciferase activity was evaluated in lysed cells using the Luciferase assay kit (Promega). The reporter plasmid levels are normalized to the −3561 ERα promoter fragment treated with the DMSO vehicle control. Two additional controls (data not shown) included CMV-luciferase to validate transfection efficiency (positive control) and pgl2 to measure background fluorescence (negative control). Bar graphs indicate relative luciferase activity normalized to the protein input. Error bars were derived from the results of three independent experiments.
Figure 9.
Figure 9.
Identification of the I3C responsive region of the ERα promoter and predicted transcription factor binding sites located within. (A) MCF-7 cells were transfected with the indicated ERα promoter 5′ deletion constructs linked to a luciferase reporter gene, and 24 h posttransfection cells were treated for 24 h with either the DMSO vehicle control or with 200 μM I3C. Relative luciferase activity was evaluated in lysed cells using the Luciferase assay kit (Promega) and normalized to the reporter plasmid activity of the −3561 ERα promoter fragment in cells treated with DMSO. Two controls (data not shown) included CMV-luciferase to validate transfection efficiency (positive control) and pgl2 to measure background fluorescence (negative control). Bar graphs indicate relative luciferase activity normalized to the protein input and error bars were derived from the results of three independent experiments. (B) Transcription factor binding site analysis of the I3C-responsive region was performed using TFSearch program, followed by manual curation of potential sites. Positions displayed are relative to the ERα promoter-A transcription start site. Bold bases indicate consensus sequences of the indicated transcription factor sites within the ERα promoter. Underlined sequence indicates the positions of site-directed mutagenesis and the mutations that were introduced into the ERα promoter.
Figure 10.
Figure 10.
Identification of GATA3 as the transcription factor responsible for ERα promoter down-regulation by I3C. (A) MCF-7 cells were transfected with luciferase reporter plasmids driven by either the wild-type ERα promoter fragment starting at −2294 upstream of the RNA site start, or with ERα promoter fragments with the designated mutations in the consensus GATA3-1, GATA3-2, or Ap1 transcription factor binding sites. Twenty-four hour-transfected cells were treated for an additional 24 h with either DMSO or 200 μM I3C. Relative luciferase activity was evaluated in lysed cells using the Luciferase assay kit (Promega). Bar graphs indicate relative luciferase activity normalized to the protein input. Values are normalized to DMSO of each transfection. Result was repeated twice. (B) Left, ERα genomic sequence containing both predicted GATA3 binding sites (bold) within the I3C-responsive region of ERα promoter. Primers used to amplify GATA3 sites for chromatin immunoprecipitation are underlined. Chromatin was isolated from MCF-7 cells treated with or without 200 μM I3C for 24 h. GATA3 was immunoprecipitated from total cell extracts using Sepharose G bound to anti-ERα antibody. DNA released from ERα was amplified using indicated primers. Control primers directed at upstream site (−3812 base pairs) showed no amplification in IP samples. Input samples represent total genomic DNA from each treatment (loading control). This result was repeated twice.
Figure 11.
Figure 11.
Proposed model for the I3C disruption of a cross-regulatory positive feedback loop involving expression of GATA3 and ERα by stimulating the degradation of ERα protein. In the absence of I3C, ERα and the GATA3 transcription factor maintain a cross-regulatory positive feedback loop that results in a high level of ERα expression. ERα stimulates GATA3 transcription by interacting with an enhancer region in the GATA3 gene, whereas GATA3 stimulates ERα promoter activity by interacting its corresponding binding sites in the ERα promoter. I3C disrupts this feedback loop by inducing the ubiquitination and proteasome-mediated degradation of ERα protein. The I3C-induced degradative pathway requires the Rbx1 E3 ubiquitin ligase and the I3C activation and nuclear localization of AhR. We propose that I3C-activated AhR tethers Rbx1 to its ERα protein substrate for ubiquitination and subsequent destruction.

Similar articles

Cited by

References

    1. Afouda B. A., Martin J., Liu F., Ciau-Uitz A., Patient R., Hoppler S. GATA transcription factors integrate Wnt signalling during heart development. Development. 2008;135:3185–3190. - PubMed
    1. Aggarwal B. B., Ichikawa H. Molecular targets and anticancer potential of indole-3-carbinol and its derivatives. Cell Cycle. 2005;4:1201–1215. - PubMed
    1. Ali S., Coombes R. C. Estrogen receptor alpha in human breast cancer: occurrence and significance. J Mammary Gland Biol. Neoplasia. 2000;5:271–281. - PubMed
    1. Antkiewicz D. S., Burns C. G., Carney S. A., Peterson R. E., Heideman W. Heart malformation is an early response to TCDD in embryonic zebrafish. Toxicol. Sci. 2005;84:368–377. - PubMed
    1. Asselin-Labat M. L. Mammary stem and progenitor cells: critical role of the transcription factor Gata-3. Med. Sci. 2007;23:1077–1080. - PubMed

Publication types