

Dynamic organisation of prolactin gene expression in living pituitary tissue
- PMID: 20130141
- PMCID: PMC2816187
- DOI: 10.1242/jcs.060434
Dynamic organisation of prolactin gene expression in living pituitary tissue
Abstract
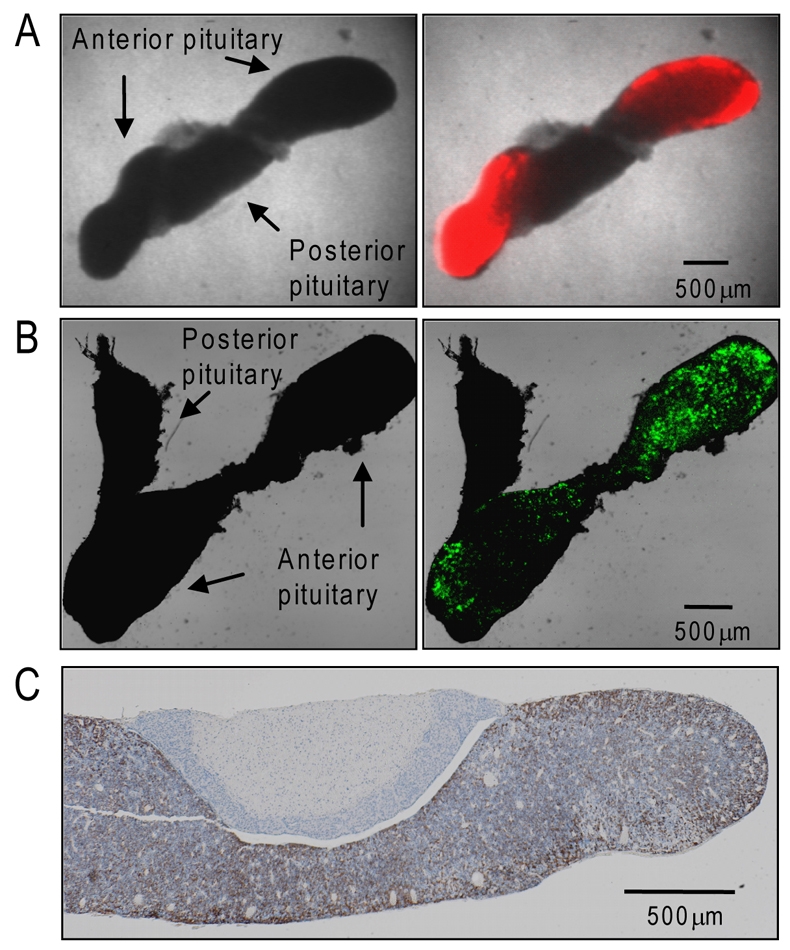
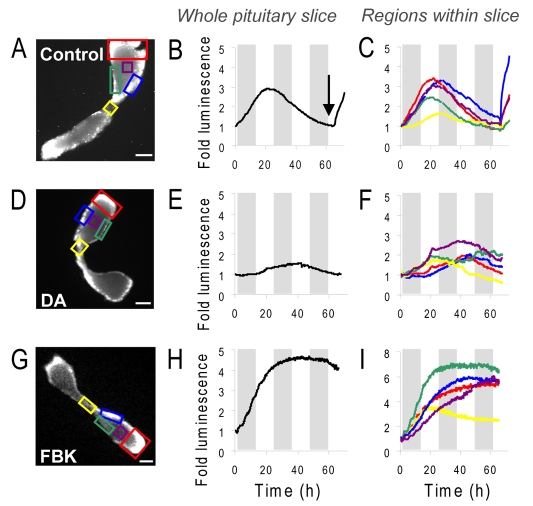
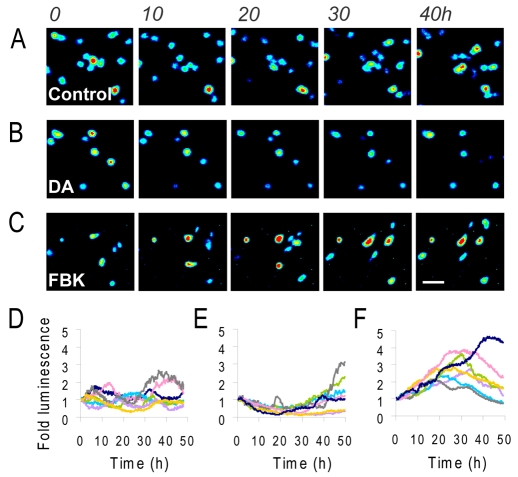
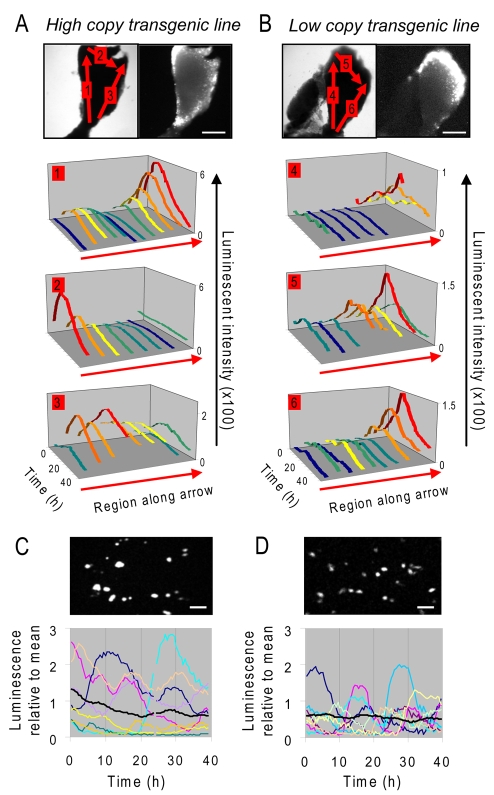
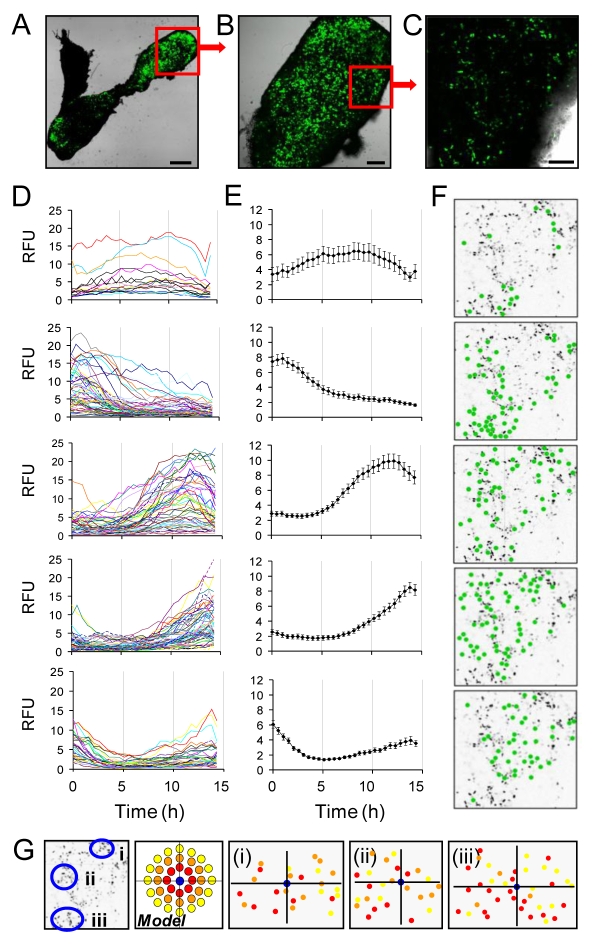
Gene expression in living cells is highly dynamic, but temporal patterns of gene expression in intact tissues are largely unknown. The mammalian pituitary gland comprises several intermingled cell types, organised as interdigitated networks that interact functionally to generate co-ordinated hormone secretion. Live-cell imaging was used to quantify patterns of reporter gene expression in dispersed lactotrophic cells or intact pituitary tissue from bacterial artificial chromosome (BAC) transgenic rats in which a large prolactin genomic fragment directed expression of luciferase or destabilised enhanced green fluorescent protein (d2EGFP). Prolactin promoter activity in transgenic pituitaries varied with time across different regions of the gland. Although amplitude of transcriptional responses differed, all regions of the gland displayed similar overall patterns of reporter gene expression over a 50-hour period, implying overall co-ordination of cellular behaviour. By contrast, enzymatically dispersed pituitary cell cultures showed unsynchronised fluctuations of promoter activity amongst different cells, suggesting that transcriptional patterns were constrained by tissue architecture. Short-term, high resolution, single cell analyses in prolactin-d2EGFP transgenic pituitary slice preparations showed varying transcriptional patterns with little correlation between adjacent cells. Together, these data suggest that pituitary tissue comprises a series of cell ensembles, which individually display a variety of patterns of short-term stochastic behaviour, but together yield long-range and long-term coordinated behaviour.
Figures
Similar articles
-
Dynamic analysis of stochastic transcription cycles.PLoS Biol. 2011 Apr;9(4):e1000607. doi: 10.1371/journal.pbio.1000607. Epub 2011 Apr 12. PLoS Biol. 2011. PMID: 21532732 Free PMC article.
-
Dynamic changes in prolactin promoter activation in individual living lactotrophic cells.Endocrinology. 1998 Mar;139(3):1361-8. doi: 10.1210/endo.139.3.5826. Endocrinology. 1998. PMID: 9492073
-
Imaging of endocrine gene expression in a humanized transgenic rat.Ann N Y Acad Sci. 2011 Dec;1245:38-9. doi: 10.1111/j.1749-6632.2011.06341.x. Ann N Y Acad Sci. 2011. PMID: 22211975
-
Real-time imaging of gene promoter activity using an adenoviral reporter construct demonstrates transcriptional dynamics in normal anterior pituitary cells.J Endocrinol. 2003 Jul;178(1):61-9. doi: 10.1677/joe.0.1780061. J Endocrinol. 2003. PMID: 12844337
-
A family of POU-domain and Pit-1 tissue-specific transcription factors in pituitary and neuroendocrine development.Annu Rev Physiol. 1990;52:773-91. doi: 10.1146/annurev.ph.52.030190.004013. Annu Rev Physiol. 1990. PMID: 2184776 Review.
Cited by
-
Molecular morphology of pituitary cells, from conventional immunohistochemistry to fluorescein imaging.Molecules. 2011 Apr 29;16(5):3618-35. doi: 10.3390/molecules16053618. Molecules. 2011. PMID: 21540793 Free PMC article. Review.
-
A continuum model of transcriptional bursting.Elife. 2016 Feb 20;5:e13051. doi: 10.7554/eLife.13051. Elife. 2016. PMID: 26896676 Free PMC article.
-
A stochastic transcriptional switch model for single cell imaging data.Biostatistics. 2015 Oct;16(4):655-69. doi: 10.1093/biostatistics/kxv010. Epub 2015 Mar 26. Biostatistics. 2015. PMID: 25819987 Free PMC article.
-
Dynamic analysis of stochastic transcription cycles.PLoS Biol. 2011 Apr;9(4):e1000607. doi: 10.1371/journal.pbio.1000607. Epub 2011 Apr 12. PLoS Biol. 2011. PMID: 21532732 Free PMC article.
-
Disentangling juxtacrine from paracrine signalling in dynamic tissue.PLoS Comput Biol. 2019 Jun 13;15(6):e1007030. doi: 10.1371/journal.pcbi.1007030. eCollection 2019 Jun. PLoS Comput Biol. 2019. PMID: 31194728 Free PMC article.
References
-
- Ben-Jonathan N., Hnasko R. (2001). Dopamine as a prolactin (PRL) inhibitor. Endocr. Rev. 22, 724-763 - PubMed
-
- Boockfor F. R., Frawley L. S. (1987). Functional variations among prolactin cells from different pituitary regions. Endocrinology 120, 874-879 - PubMed
-
- Christian H. C., Chapman L. P., Morris J. F. (2007). Thyrotrophin-releasing hormone, vasoactive intestinal peptide, prolactin-releasing peptide and dopamine regulation of prolactin secretion by different lactotroph morphological subtypes in the rat. J. Neuroendocrinol. 19, 605-613 - PubMed
Publication types
MeSH terms
Substances
Grants and funding
- BB/E012965/1/BB_/Biotechnology and Biological Sciences Research Council/United Kingdom
- MC_U127685843/MRC_/Medical Research Council/United Kingdom
- G002.00007.01/MRC_/Medical Research Council/United Kingdom
- 67252/WT_/Wellcome Trust/United Kingdom
- BBE0129651/BB_/Biotechnology and Biological Sciences Research Council/United Kingdom
LinkOut - more resources
Full Text Sources
