

Practice Guideline
doi: 10.1164/rccm.200809-1522ST.
An official research policy statement of the American Thoracic Society/European Respiratory Society: standards for quantitative assessment of lung structure
Collaborators
- PMID: 20130146
- PMCID: PMC5455840
- DOI: 10.1164/rccm.200809-1522ST
Item in Clipboard
Practice Guideline
An official research policy statement of the American Thoracic Society/European Respiratory Society: standards for quantitative assessment of lung structure
Am J Respir Crit Care Med.
.
No abstract available
Figures
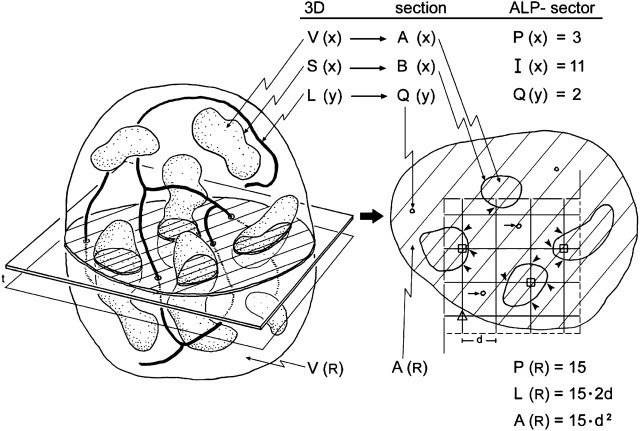
Structural parameters and their stereological representation. A structure
(left) of total reference volume V(R) containing particles of
volume V(x) and surface S(x) as well as thread-like features of length L(y) is
randomly sectioned. On an isotropic uniform random (IUR) section
(right) the profiles of x are characterized by their area A(x)
and boundary B(x), the feature y appears as a number of small transects Q(y), while
the reference space is represented by the section area A(R). Applying a coherent
stereological test grid (ALP-sector) with test points PT = 16, test lines
LT = PT · 2d, and test area AT =
PT · d2 to the section allows to assess volume,
surface, and length densities per unit volume from point hits P(x) (marked
by squares), intersection counts I(x) (arrowheads), and
transect counts Q(y) (short arrows) whereby the reference area is
estimated by the number of test points included in the section profile P(R), that
is, excluding the points falling outside (marked by triangle). In
this example P(R) = 15; the actual test area is A(R) = P(R) · d2,
and the length of test line included in the sample is L(R) = P(R) · 2d. Using a
second parallel section a distance t apart and the counting frame with area A(R)
(disector), the numerical density of particles per unit volume can be assessed from
counting particle tops Q−(x) in the disector volume A(R) · t.
Reproduced by permission from Reference .
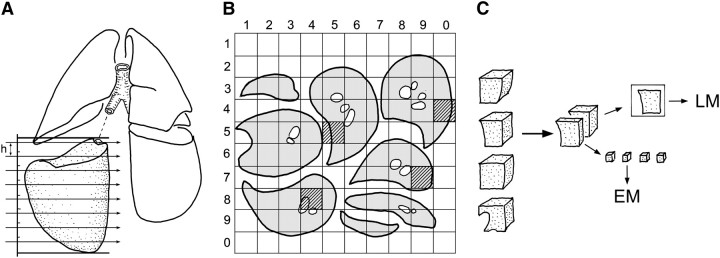
Stratified uniform random sampling (StURS) of dog lung by division into four
regional strata of similar size, for example, upper and lower strata of left and
right lung (207). (A)
In each stratum, serial slices of thickness h are generated by Cavalieri sampling
with random start of first cut. (B) The slices are laid out with
upper cut surface up; a grid of 10 × 10 rows is overlaid to identify four
samples by generating two-digit random numbers that hit the lung parenchyma
(gray squares). (C) The sample blocks are
divided and embedded for light microscopy (LM) and electron microscopy (EM);
alternatively, one may obtain independent random number samples for LM and EM.
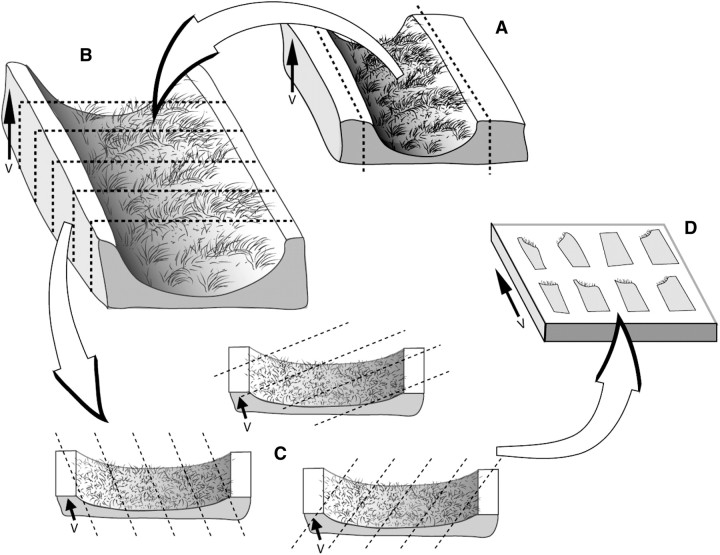
Vertical sections. (A) An arbitrary horizontal reference plane,
such as a cutting board, is considered fixed and the vertical section is
perpendicular to this horizontal plane. Airways selected by microdissection can be
sampled by this vertical section scheme, by bisecting the airway longitudinally
and laying it flat with the luminal surface up. In this orientation, the
arrow that runs from base to apex of the epithelium indicates
the direction of the vertical axis, V. (B) Bisected airway can be
cut into strips of tissue. (C) Each airway tissue strip is cut
following a random rotation of the cutting angle to achieve uniform randomness.
(D) The blocks are then selected by SURS procedures for
embedding with the vertical direction maintained in the embedding mold. Reproduced
by permission from Reference .
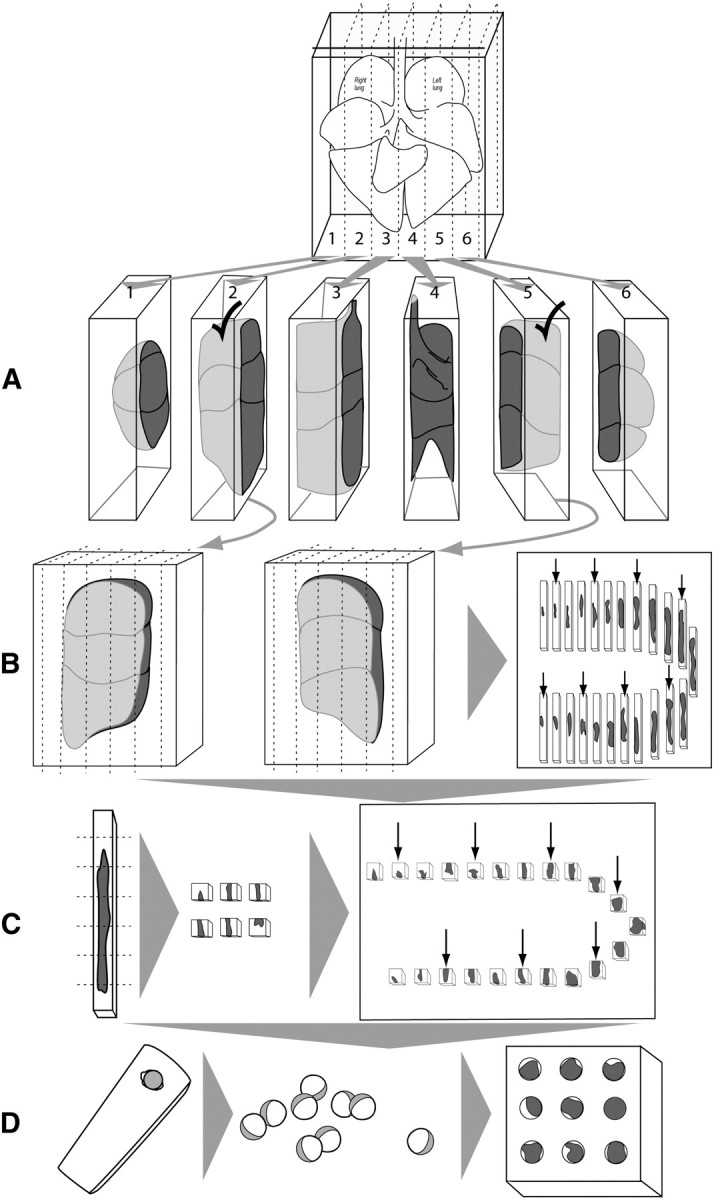
Isotropic uniform random sampling scheme, comprised of uniform sampling
(smooth fractionator) followed by procedures that ensure
isotropic orientation (isector). (A) A lung is
embedded in agar and cut into slabs at a constant interval and a random start of
the first cut. (B) Each slab is laid flat (two are shown) and the
lung volumes estimated by point counting (volume = thickness × area). The
selected slabs are cut into bars with the same width as the slab thickness, and
sorted according to the area of the upper surface (e.g., largest to smallest).
Every third bar is selected (shown by arrows, a fractionator
sequence with sampling fraction = 1/3 using a random start). (C)
Each selected bar is cut into bricks, sorted again according to the area of the
upper surface, and every third bar is selected (shown by arrows,
continuing the fractionator sequence at sampling fraction = 1/3 using random
start). (D) To ensure isotropic orientation, the selected bricks
are placed into spherical embedding molds (in agar or plastic), allowed to harden,
removed from the mold, and rolled on the bench top before further embedding,
sectioning, and staining.
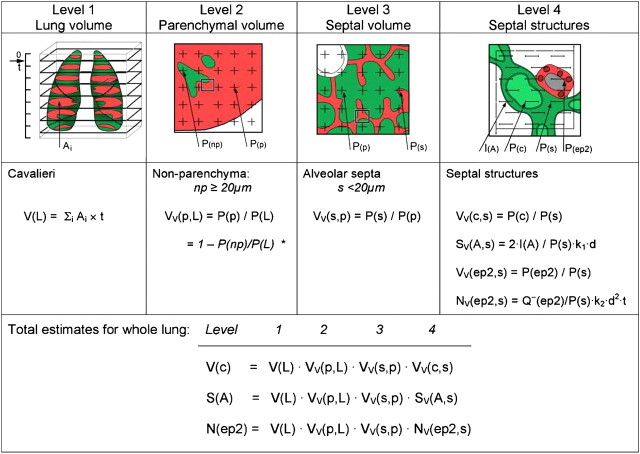
Estimating morphometric parameters of lung parenchyma using multistage stratified
sampling at four levels of increasing magnification. The parameter estimated at one
level becomes the reference parameter at the next higher level. This approach allows
calculation of total estimates pertaining to the whole lung and permits efficient
sampling. Level 1 is Cavalieri sampling, allowing estimation of lung volume. Level 2
and level 3 sections are overlaid with a simple point grid to estimate volume
fractions, whereas at level 4 an electron micrograph is overlaid with a multipurpose
test system comprising a set of test line segments within an unbiased counting frame
(Section 2). *Because nonparenchyma occupies a small fraction of the
lung, it may be more efficient to estimate VV(np).
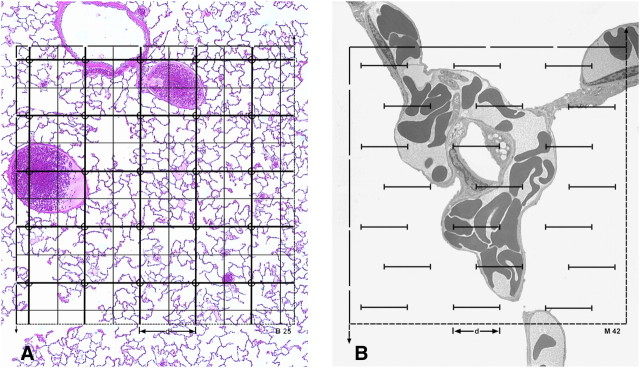
Coherent test grids for point counting stereology combining test points
PT spaced by distance d with lines of length LT =
PT · 2d in an unbiased counting frame of a test area AT
= PT · d2. (a) Light micrograph of dog
lung with double lattice square grid with PT = 100, of which 25 are
marked as coarse point grid; counting is efficient if rare components (∼10%)
are counted with the complete grid and frequent components with the coarse grid.
(b) Electron micrograph of dog lung with short-line test grid
(LT = 21 d, PT = 42, AT = PT ·
0.866·d2) for combined estimation of alveolar surface by
intersection count with the lines and capillary volume by counting hits of the
endpoints. With such a grid counting becomes efficient because the counting events
are similar for surface intersections and volume point hits (here I(A) = 10, I(c) =
8, P(c) = 10). Adapted by permission from Reference .
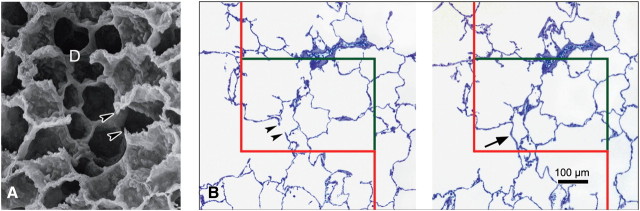
Unbiased estimation of alveolar number by counting alveolar openings using the
physical disector. (a) Under scanning electron microscopy, alveolar
openings into the alveolar duct (D) are marked by their entrance rings, thus forming
the network-like duct wall. Note that entrance rings at the cut surface of the
specimen are visible as free edges of alveolar septae (arrowheads).
(b) In practice, the number of entrance rings is counted in
paired parallel histological sections using the physical disector technique at light
microscopic level. Counting can be performed in both directions—that is, using
each section once as sampling section (for counting) and once as look-up section
(for comparison) using an unbiased counting frame with exclusion line
(red) and inclusion line (green). In histologic
sections, the network of alveolar entrance rings is represented by the free edges of
alveolar septae (arrowheads). The counting event is the presence of
a bridge connecting the free edges of alveolar septae in the sampling section
(arrow) but not the look-up section. (b) Adapted
by permission from Reference .
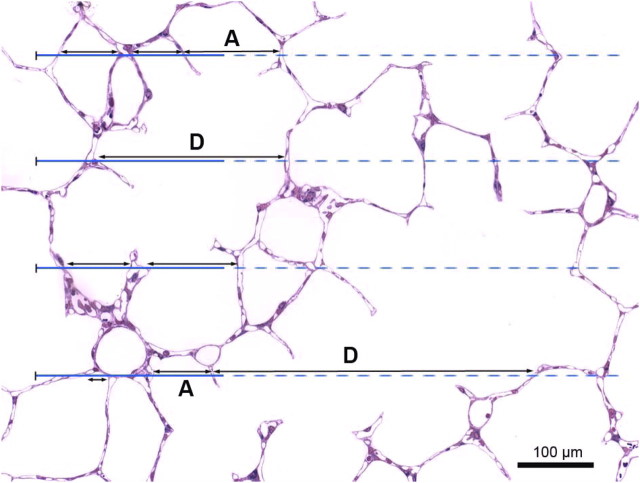
Principle of chord length measurement. Perfusion-fixed rabbit lung with a set of
test lines for measuring chord lengths between intersections with the alveolar
surface. Intercepts, marked by double-ended arrows, are measured if
the solid part of the test line intersects an alveolar surface at least once (118). Note that some intercepts span one
alveolus (A), whereas others cross the alveolar duct between two alveoli (D).
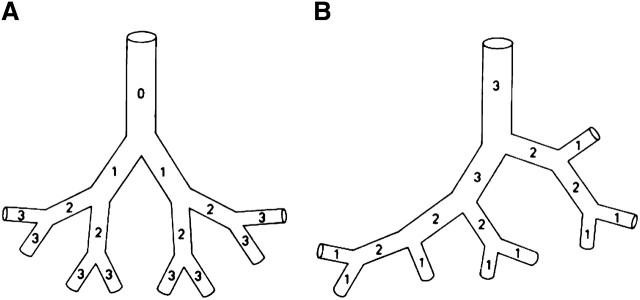
Airway branch ordering systems. (A) Dichotomy;
(B) Strahler ordering system.
References
-
- Lum H, Mitzner W. Effects of 10% formalin fixation on fixed lung volume and lung tissue shrink: a comparison of eleven laboratory species. Am Rev Respir Dis 1985;132:1078–1083. - PubMed
-
- Kendall MG, Moran PAP. Geometrical probability. London: Charles Griffin and Co., Ltd.; 1963. pp. 1–125.
-
- Miles RE, Davy PJ. Precise and general conditions for the validity of a comprehensive set of stereological fundamental formulae. J Microsc 1976;107:211–226.
-
- Miles RE, Serra J. Geometrical probability and biological structures: Buffon's 200th anniversary. Lecture notes in biomathematics [Vol 23]. New York: Springer-Verlag; 1978.
-
- Cruz-Orive LM. Stereology: historical notes and recent evolution. Acta Stereol 1987;6:43–56.
Publication types
MeSH terms
Substances
Grants and funding
LinkOut - more resources
Full Text Sources
Other Literature Sources
Medical
