. 2010 Feb 3;30(5):1686-98.
doi: 10.1523/JNEUROSCI.3098-09.2010.

Model calcium sensors for network homeostasis: sensor and readout parameter analysis from a database of model neuronal networks

Affiliations

Model calcium sensors for network homeostasis: sensor and readout parameter analysis from a database of model neuronal networks

Cengiz Günay et al. J Neurosci. .

Abstract

In activity-dependent homeostatic regulation (ADHR) of neuronal and network properties, the intracellular Ca(2+) concentration is a good candidate for sensing activity levels because it is correlated with the electrical activity of the cell. Previous ADHR models, developed with abstract activity sensors for model pyloric neurons and networks of the crustacean stomatogastric ganglion, showed that functional activity can be maintained by a regulation mechanism that senses activity levels solely from Ca(2+). At the same time, several intracellular pathways have been discovered for Ca(2+)-dependent regulation of ion channels. To generate testable predictions for dynamics of these signaling pathways, we undertook a parameter study of model Ca(2+) sensors across thousands of model pyloric networks. We found that an optimal regulation signal can be generated for 86% of model networks with a sensing mechanism that activates with a time constant of 1 ms and that inactivates within 1 s. The sensor performed robustly around this optimal point and did not need to be specific to the role of the cell. When multiple sensors with different time constants were used, coverage extended to 88% of the networks. Without changing the sensors, it extended to 95% of the networks by letting the sensors affect the readout nonlinearly. Specific to this pyloric network model, the sensor of the follower pyloric constrictor cell was more informative than the pacemaker anterior burster cell for producing a regulatory signal. Conversely, a global signal indicating network activity that was generated by summing the sensors in individual cells was less informative for regulation.


Figures

Figure 1.
Figure 1.
Biological pyloric rhythmic activity pattern and the model circuit architecture. A, The triphasic rhythm recorded intracellularly from the American lobster (Homarus americanus) pyloric neurons. The figure was reproduced from Prinz et al. (2004) B, Simplified model of the pyloric network. All synapses in the circuit are inhibitory. Open circles represent fast glutamatergic synapses, and filled circles represent slow cholinergic synapses.
Figure 2.
Figure 2.
The sensor and readout components within the context of ADHR. A, Engineering-style schematic illustrating the full feedback loop of ADHR. The scope of this paper is depicted with the dashed rectangle, in which ICa is used to generate an error signal. The error is calculated by the readout as the difference between the average of the sensors (average) over the network rhythm period, T, and a set point. Based on this error, a hypothetical regulatory mechanism can use a direction, Aj, to adjust each maximal conductance, such as Ca that modulates ICa based on voltage, V. B, The sensors are defined with the steady-state curves of their activation (M) and inactivation (H) variables (Eqs. 2–4). C, The readout can be a linear classifier that separates functional networks from nonfunctional networks by drawing a hyperplane in the average sensor parameter space of two example (fast and slow) sensors. D, When the input classes are linearly nonseparable, the readout must use multiple hyperplanes.
Figure 3.
Figure 3.
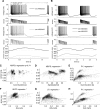
Functional versus nonfunctional activity patterns of the model network are reflected in the sensor readings. A, Model network with a single, same activity sensor (X) in each of the three cells. B, Example functional activity pattern produced by the model network (top; see parameters of network #4950096 in supplemental Table S1, available at www.jneurosci.org as supplemental material) and corresponding ICa (middle) and sensor readings (bottom traces from sensor #87; for parameters, see supplemental Table S2, available at www.jneurosci.org as supplemental material). Color coding is the same as in A. C, An example nonfunctional network producing tonic and silent firing activity patterns (network #4950003). D, Using the outputs of the best performing sensor, the classifier separated previously labeled functional and nonfunctional networks by assigning different weights to the activity sensor of each cell. The offset value is a constant (see Materials and Methods). E, The classifier score distribution shows the separation between functional and nonfunctional networks with a threshold of 0.5 (dashed vertical line). Scores of networks in other panels are marked on the x-axis line. F, An example nonfunctional model network (#4959071) that lies at the extreme of false-positive classifier estimations with a score of 0.8 (see E).
Figure 4.
Figure 4.
Activity sensors represented both the bursting activity and the rhythm period of a cell, being a good indicator of the bursting duty cycle. The sensor used is the same as in Figure 3. A, Traces from AB/PD models in two example networks (solid and dashed lines) show that, when the cell rhythm period is invariant (∼1.6 s), an increase in the burst duration (from 0.6 to 0.8 s) increases the sensor cumulative average (sensor cum. avg.; bottom trace) and, therefore, the sensor period average (dotted line). Network model parameters are given in supplemental Table S1 (available at www.jneurosci.org as supplemental material). burst dur., Burst duration. B, Other example AB/PD models show that increasing the rhythm period (from 1.6 to 2.4 s) decreased the sensor period average for cells with similar burst durations (0.7–0.8 s). C, The AB/PD burst duration was not significantly correlated with its sensor average. D, The AB/PD sensor average and number of spikes were significantly correlated (*p < 10−4). To avoid saturation in the scatter plot, uniform noise between −0.5 and +0.5 was added to the number of spikes after regression. E, The PY sensor average was significantly correlated with its burst duration. F–H, All three model cell sensor averages showed significant correlations to their duty cycle characteristic. The correlation was no longer positive for LP in G for physiologically unrealistic duty cycles larger than 0.5.
Figure 5.
Figure 5.
Activity sensors provide more information than activity characteristics such as bursting duty cycle, and activation and inactivation variables improve the estimation from sensors. A, Comparison of estimation success rates obtained from various activity characteristics compared with the success achieved by using activity sensors (#87; for parameters, see supplemental Table S2, available at www.jneurosci.org as supplemental material) in each model cell. all char., Estimation done with all characteristics. 50% success indicates estimation at chance level. B, Comparison of success obtained from Ca2+-related quantities and different types of sensors. The best activation-only sensor (#365) is inferior to the best inactivating sensor (#87). C, In the normalized frequency of success obtained from the 366 different calcium sensors tested at the same time in all three model cells, non-inactivating sensors (n = 36) were inferior to inactivating sensors (n = 330). The maximum estimation success reached 86.40%. Success rates were collected in 50 bins for inactivating and in 10 bins for the non-inactivating sensors. D, Using minimum and maximum values of a single (activating and inactivating) sensor in addition to its average increased the estimation success to 87.46%. E, Using the same fast, slow, and DC (FSD) sensors in all model cells (see Materials and Methods) yielded 85,750 combinations of the FSD sensors from which we found a maximum estimation success of 88.17%. Histograms contain 50 bins in last two panels.
Figure 6.
Figure 6.
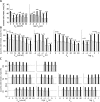
Sensor time constant (τ) and calcium current sensitivity (Z) parameters are broadly tuned. In the bar plots, the inner bars show the maximal success, and open bars show the mean success. The dotted horizontal line shows the mean success from all sensors. A, Success with varying activation variable parameters of the non-inactivating sensors (n = 33; 3 sensors that always produced 0 output were omitted). The n values for each bar vary based on the sensor construction rules (see Materials and Methods). B, Same as A but for inactivating sensors (n = 330). C, Success for parameter values for each of the fast (F), slow (S), and DC (D) sensors.
Figure 7.
Figure 7.
Local sensors can estimate network activity and sensor variety between cells does not yield better estimation success. A, A different activity sensor (Xi, i ϵ 1, 2, 3) in each model cell used individually to estimate the network outcome. The distribution of success rates from 366 sensors (20 bins) in each of the three cells are superimposed for comparison, which showed a different maximal success from each cell sensor. B, Combined sensor readings from three model cells to simulate a global sensor reading (50 bins). C, Classifiers with different weight and offset values were found for each of the different sensor types in each cell (for sensor parameters, see supplemental Table S2, available at www.jneurosci.org as supplemental material) for obtaining the best success rates in A. D, When the outputs of the best sensors from each cell are used together to classify functional networks, the signs of the individual weights found in C are maintained.
Figure 8.
Figure 8.
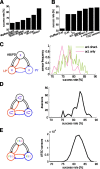
Classifier weights of best performing sensors consistently selected specific proportions of the sensor of each cell for classifying functional network activity. A, Weights found by the top 11 best sensors were consistent (best sensor being the rightmost, brown color). B, Mean and SD of the sensors with success >80% (n = 63) maintained the same proportions between the weights of sensors of different cells and the offset value. The weight of each cell sensor was significantly different from each of the others (p < 10−4, same for separate one-way ANOVA for each pair and also one for all together). C–E, Distribution of the average optimal sensor readings from the three cells (each into 100 bins) for all networks classified (C; n = 9915, the truncated 0 bins showing no activity were 4208 for AB/PD, 663 for LP, and 5662 for PY), for functional networks (D; n = 221), and for classified functional networks (E; n = 2834).
Figure 9.
Figure 9.
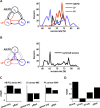
The calcium sensors misclassified ∼12% of the networks. A, Two example network traces, one from a functional (top; network #4950161) and one from a nonfunctional (bottom; network #4950088), producing very similar activity patterns, except when the LP activity overlap with PY activity pushes it outside of the biological range of functional patterns. The two networks have similar parameters (supplemental Table S1, available at www.jneurosci.org as supplemental material). B, The FSD sensor outputs from these two networks were identical, except a larger DC sensor average indicated the longer LP activity in the nonfunctional network. C, Comparison of the classifier weights for each of the nine sensors in the network indicated that the LP sensors were most important in determining the classifier score.
Figure 10.
Figure 10.
Increasing the number of decision boundaries (hyperplanes) of the classifier allowed to make finer and more accurate estimations of functional network patterns. A, Adding hyperplanes in classifying with the optimal FSD sensor triplet (#34,457; see Table 1) from all cells improved classification success from 88 to 95%. B, Hyperplane weights indicate the importance of each hyperplane in the estimation. C, Mean and SD of sensor weights for hyperplanes 1, 2, and 3.

Similar articles

Cited by

References

    1. Abbott L, LeMasson G. Analysis of neuron models with dynamically regulated conductances. Neural Comp. 1993;5:823–842.
    1. Achard P, De Schutter E. Complex parameter landscape for a complex neuron model. PLoS Comput Biol. 2006;2:e94. - PMC - PubMed
    1. Achard P, De Schutter E. Calcium, synaptic plasticity and intrinsic homeostasis in purkinje neuron models. Front Comput Neurosci. 2008;2:8. - PMC - PubMed
    1. An WF, Bowlby MR, Betty M, Cao J, Ling HP, Mendoza G, Hinson JW, Mattsson KI, Strassle BW, Trimmer JS, Rhodes KJ. Modulation of A-type potassium channels by a family of calcium sensors. Nature. 2000;403:553–556. - PubMed
    1. Baines RA, Uhler JP, Thompson A, Sweeney ST, Bate M. Altered electrical properties in Drosophila neurons developing without synaptic transmission. J Neurosci. 2001;21:1523–1531. - PMC - PubMed

Publication types

LinkOut - more resources