. 2010 Feb 3;30(5):1739-49.
doi: 10.1523/JNEUROSCI.5100-09.2010.

Global deprivation of brain-derived neurotrophic factor in the CNS reveals an area-specific requirement for dendritic growth

Affiliations

Global deprivation of brain-derived neurotrophic factor in the CNS reveals an area-specific requirement for dendritic growth

Stefanie Rauskolb et al. J Neurosci. .

Abstract

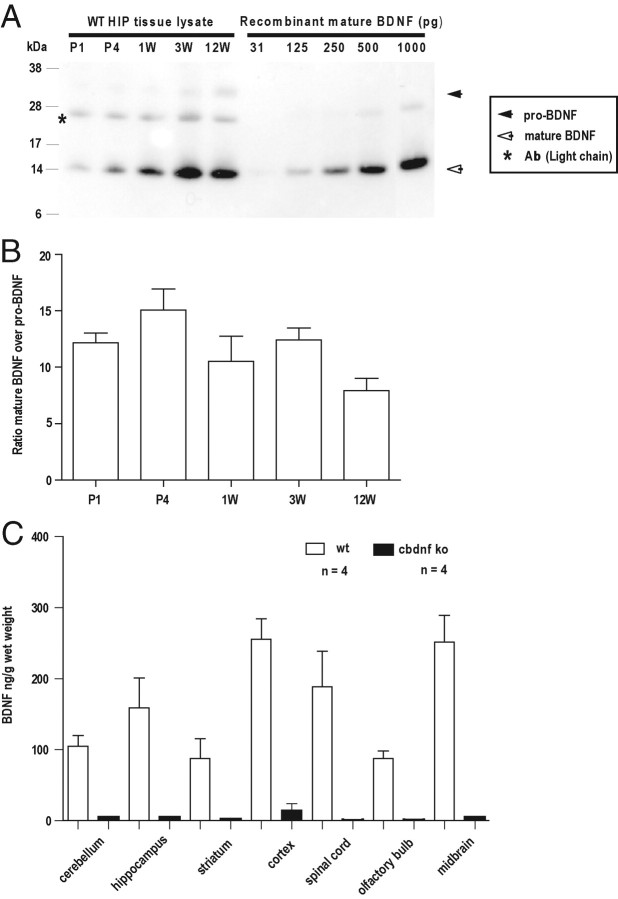
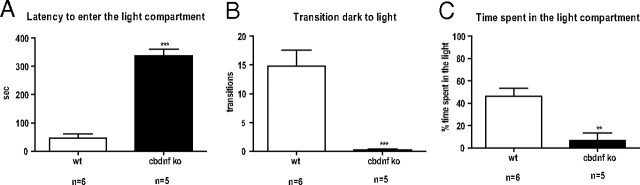
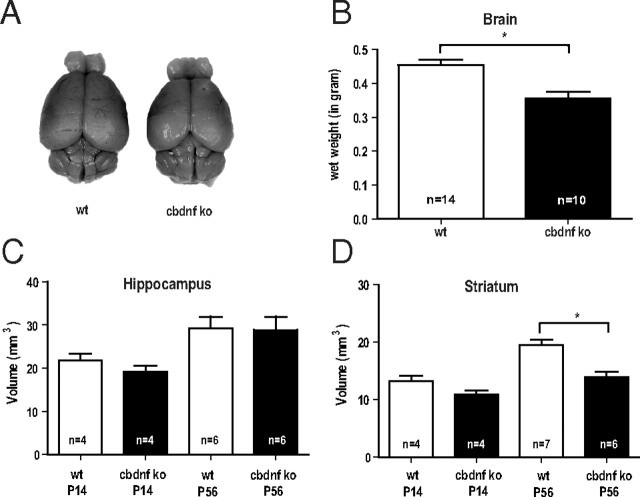
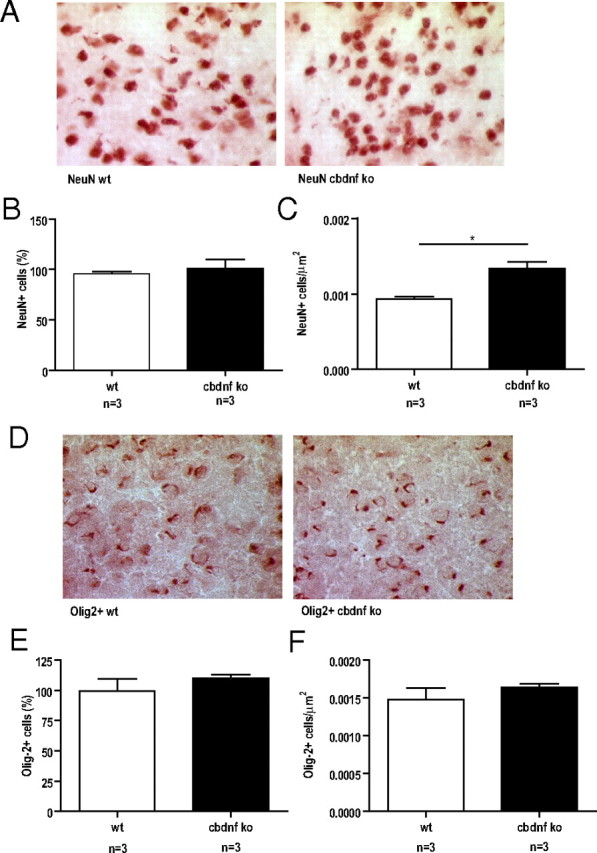
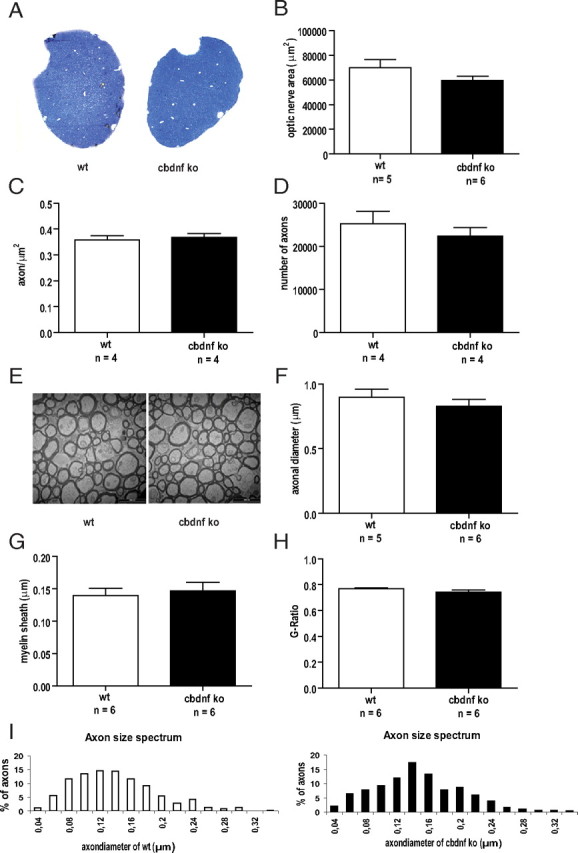
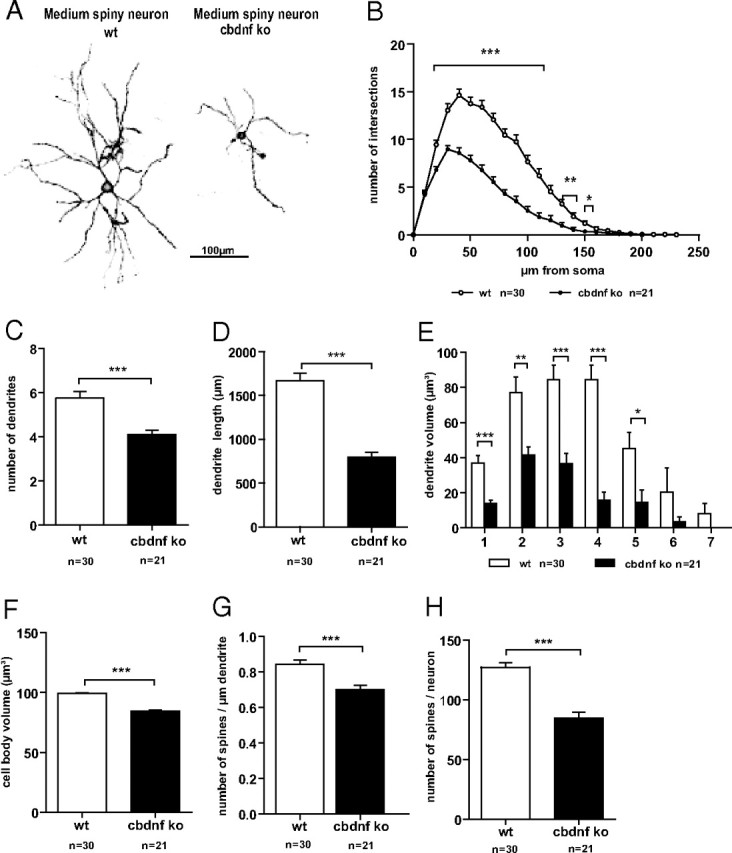
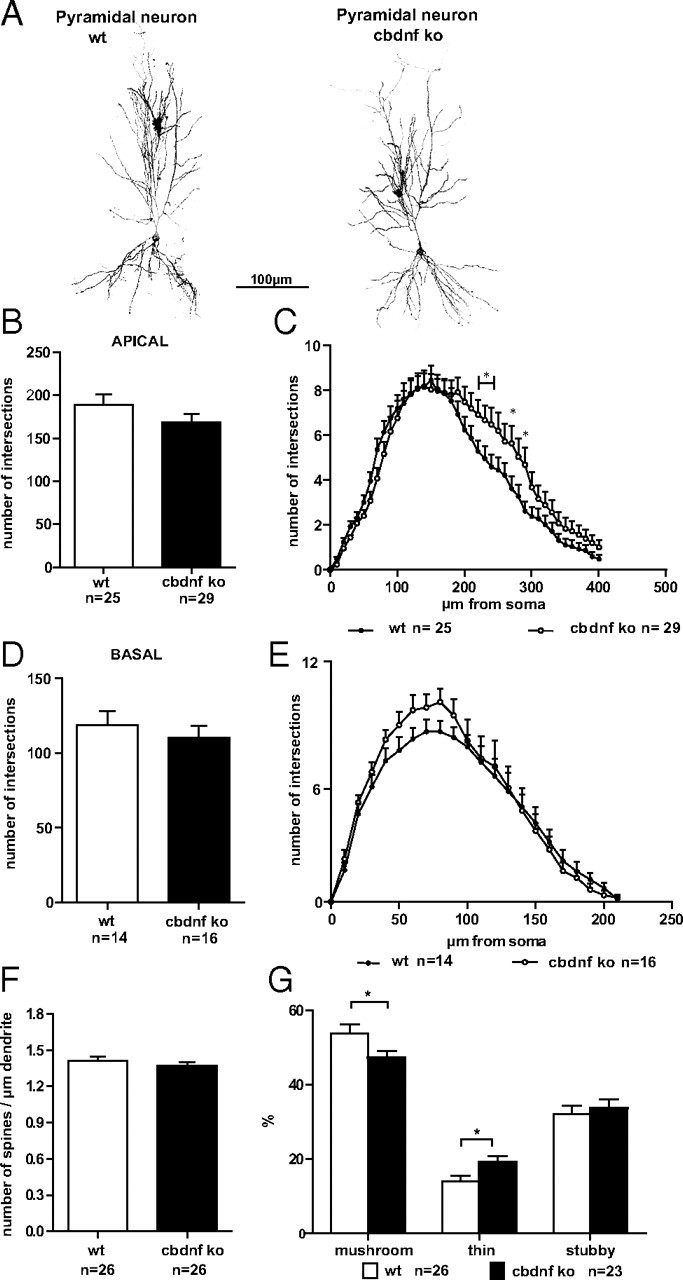
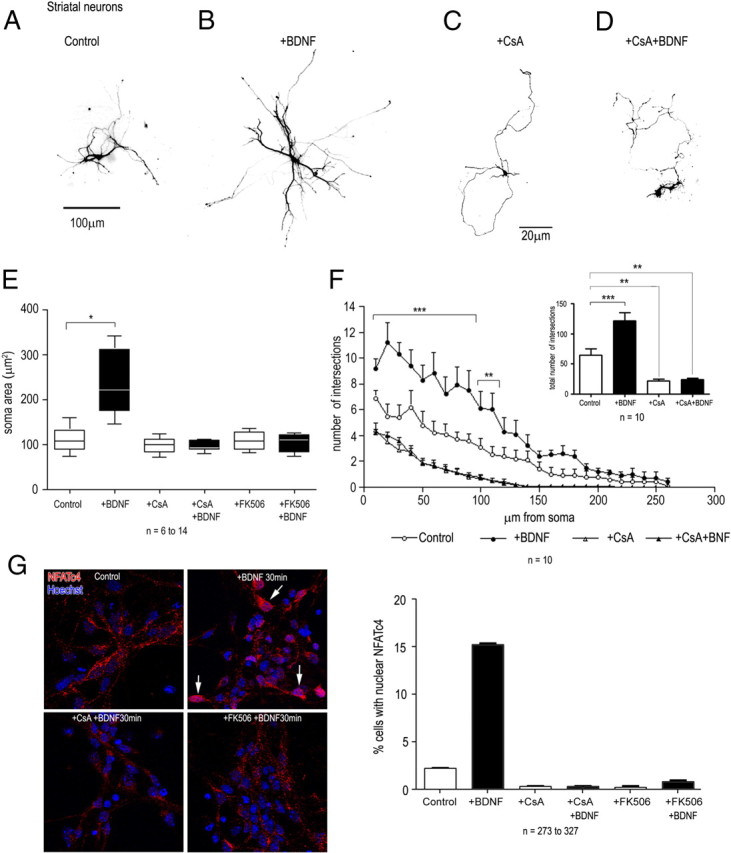
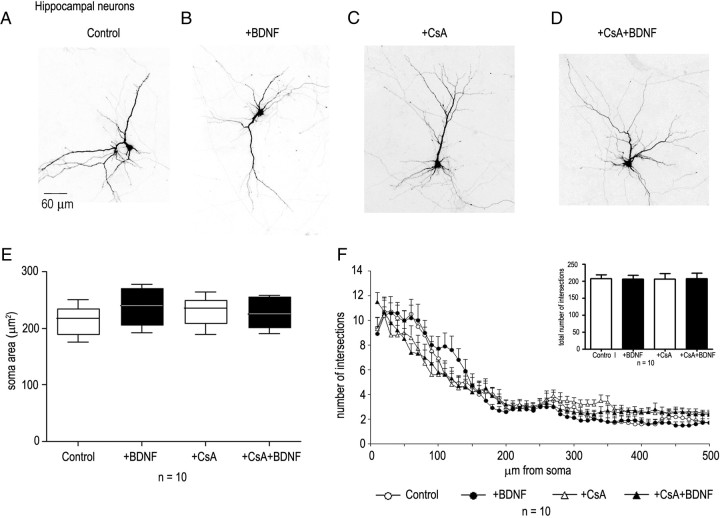
Although brain-derived neurotrophic factor (BDNF) is linked with an increasing number of conditions causing brain dysfunction, its role in the postnatal CNS has remained difficult to assess. This is because the bdnf-null mutation causes the death of the animals before BDNF levels have reached adult levels. In addition, the anterograde axonal transport of BDNF complicates the interpretation of area-specific gene deletion. The present study describes the generation of a new conditional mouse mutant essentially lacking BDNF throughout the CNS. It shows that BDNF is not essential for prolonged postnatal survival, but that the behavior of such mutant animals is markedly altered. It also reveals that BDNF is not a major survival factor for most CNS neurons and for myelination of their axons. However, it is required for the postnatal growth of the striatum, and single-cell analyses revealed a marked decreased in dendritic complexity and spine density. In contrast, BDNF is dispensable for the growth of the hippocampus and only minimal changes were observed in the dendrites of CA1 pyramidal neurons in mutant animals. Spine density remained unchanged, whereas the proportion of the mushroom-type spine was moderately decreased. In line with these in vivo observations, we found that BDNF markedly promotes the growth of cultured striatal neurons and of their dendrites, but not of those of hippocampal neurons, suggesting that the differential responsiveness to BDNF is part of a neuron-intrinsic program.


Figures

Figure 1.
Figure 1.
Determination of BDNF levels. A, The hippocampi of wild-type animals were lysed, incubated with a monoclonal antibody recognizing both pro-BDNF and mature BDNF, and examined by Western blot analysis. Note the marked increase of BDNF levels during the first postnatal weeks. B, Quantification of the ratio mature BDNF over pro-BDNF (±SEM) (n = 3). C, BDNF determination by ELISA at P56 in various CNS areas. All results are presented as a mean determined from the analysis of four mice per genotype (p < 0.001, unpaired t test). The white bars represent wild type, and the black bars represent cbdnf ko mice.
Figure 2.
Figure 2.
cbdnf ko mice have a markedly decrease exploratory behavior. A, Latency of first entry into the light compartment during the dark/light exploration test. B, Number of dark/light compartment transitions during the dark/light exploration test. C, Total time spent in the light chamber during the dark/light exploration test. Each wild-type (white columns) and mutant animal (black columns) was tested for a period of 6 min. All results are presented as mean ± SEM determined from the analysis of n mice per genotype (**p < 0.01, ***p < 0.001, unpaired t test).
Figure 3.
Figure 3.
The pan-CNS BDNF deprivation unequally affects postnatal brain growth. A, Examples of a brain of a wild-type and of a cbdnf ko animal at 2 months. B, The brain wet weight of cbdnf ko mice was significantly different from wild-type mice. C, D, Volumes were determined using Nissl-stained sections of P14 and P56 hippocampi and striata from wild-type and cbdnf ko mice by Cavalieri analysis. All results are presented as mean ± SEM determined from the analysis of n mice per genotype (*p < 0.05, unpaired t test). The white bars represent wild type, and the black bars represent cbdnf ko mice.
Figure 4.
Figure 4.
Number and density of neurons and oligodendrocytes in the striatum of 2-month-old mice. Representative images of the striatum of wild-type and cbdnf ko mice immunostained for NeuN (A) and for Olig-2 (D). B, Number of NeuN-positive cells in the striatum of wild-type and cbdnf ko mice. No significant differences were detected between the genotypes. C, Neuronal density in the striatum is higher in cbdnf ko mice compared with wild-type animals. E, Number of Olig-2-positive cells in the striatum of wild-type and cbdnf ko mice. No significant differences were detected between the genotypes. F, Oligodendrocyte density in the striatum of cbdnf ko mice compared with wild-type animals was not significantly different. All results are presented as a mean ± SEM determined from the analysis of n mice per genotype (*p < 0.05, unpaired t test). The white bars represent wild type, and the black bars represent cbdnf ko mice.
Figure 5.
Figure 5.
Comparative analysis of the optic nerve from wild-type and cbdnf ko mice. A, Light micrographs of semithin sections stained with toluidine blue of wild-type and cbdnf ko mice. Total area of the optic nerve (B), axonal density (C), and axonal numbers (D) in the optic nerve of cbdnf ko mice were not significantly different from wild-type values. E, Representative EM pictures of myelinated fibers in cross-sections of the optic nerve from wild-type and cbdnf ko animals. Axonal diameters (F), myelin sheath thickness (G), and G ratio (H) of cbdnf ko animals were not significantly different from wild type. Axonal diameters distribution of the optic nerve for a total of 455 axons (I). The frequency histogram indicates a unimodal pattern in both wild-type and cbdnf ko animals. All results are presented as mean ± SEM determined from the analysis of n mice per genotype (unpaired t test). The white bars represent wild-type, and the black bars represent cbdnf ko mice.
Figure 6.
Figure 6.
Dendritic morphology of striatal neurons from wild-type and cbdnf ko animals. Confocal image consisting of stacks of multiple optical sections showing the morphology of wild-type and cbdnf ko striatal neurons (A). Note the smaller size of striatal neurons in cbdnf ko mice. B, Sholl analysis comparing dendritic complexity in wild-type and cbdnf ko striatal neurons. Total number of dendrites (C), total dendritic length (D), total volume of the dendrites within the different branch orders (E), total cell body volume (F), spine density (G), and total number of spines per neuron (H) in wild-type and cbdnf ko striatal neurons. All results are presented as mean ± SEM determined from the analysis of n striatal neurons per genotype (*p < 0.05, **p < 0.01, and ***p < 0.001; Student's t test). Scale bar, 100 μm. The open circles/bars represent wild type, and the black circles/bars represent cbdnf ko striatal neurons.
Figure 7.
Figure 7.
Dendritic morphology of hippocampal CA1 neurons from wild-type and cbdnf ko animals. A, Confocal image consisting of stacks of multiple optical sections showing the morphology of wild-type and cbdnf ko pyramidal neurons. Note the essentially unchanged dendrite complexity and length of pyramidal neurons in cbdnf ko compared with wild-type mice. B, D, Number of apical and basal dendrite intersections in wild-type and cbdnf ko pyramidal neurons. C, E, Sholl analysis comparing both apical and basal dendrites in wild-type and cbdnf ko pyramidal neurons. Spine density (F) and distribution of different spine types (G) in wild-type and cbdnf ko hippocampal CA1 neurons. All results are presented as mean ± SEM determined from the analysis of n CA1 pyramidal neurons per genotype (*p < 0.05, Student's t test). Scale bar, 100 μm. The open circles/bars represent wild-type CA1 pyramidal neurons, and the black circles/bars represent cbdnf ko CA1 pyramidal neurons.
Figure 8.
Figure 8.
Effects of BDNF, cyclosporin A, and FK506 on the growth of striatal neurons and on NFATc4 nuclear translocation. Neurons were transfected after 1 d in vitro with a GFP reporter plasmid, BDNF (40 ng/ml) was added after 2 d, and the cultures were examined after an additional 5 d. Cyclosporin A (1 μm) or FK506 (100 nm) were added 1 h before BDNF. GFP- and GAD65/67-positive neurons were analyzed by fluorescence microscopy (A, B). BDNF treatment caused a significant increase in soma area (t test, p < 0.001) (E) and in the number and length of dendritic intersections (ANOVA; p < 0.001 from 10 to 90 μm; p < 0.01 from 100 to 110 μm from the cell body), as well as in the total number of dendritic intersections (t test; p < 0.001) (F). Cyclosporin A blocked the growth and arborization of untreated, as well as of BDNF-treated neurons (C–F). G, CsA and FK506 blocked the nuclear transfer of NFATc4 (arrows) observed after BDNF addition to striatal neurons. Nuclear translocation was assessed by counting the number of Hoechst- and NFATc4-positive nuclei. Data represent the mean ± SEM determined from the analysis of n neurons per condition. Statistical analysis were performed with Student's t test and with ANOVA followed by Bonferroni's post hoc test. *p < 0.05; **p < 0.01; ***p < 0.001. Scale bars: A, B, 100 μm; C, D, 20 μm.
Figure 9.
Figure 9.
Effect of BDNF and of cyclosporin A on the growth of hippocampal neurons. Neurons were transfected after 1 d with a GFP reporter vector, BDNF (40 ng/ml) was added after 2 d, and the cultures were examined after an additional 5 d. Cyclosporin A was added 1 h before BDNF. GFP-positive, GAD65/67-negative neurons were analyzed by fluorescence microscopy (A, B). Quantitative analysis failed to reveal any significant differences on the morphology of neurons with BDNF and/or cyclosporin A compared with untreated cultures (C–F). Data represent the mean ± SEM determined from the analysis of 10 neurons per condition. Statistical analysis were performed with Student's t test and with ANOVA followed by Bonferroni's post hoc test. Scale bar, 60 μm.

References

    1. Altar CA, Siuciak JA, Wright P, Ip NY, Lindsay RM, Wiegand SJ. In situ hybridization of trkB and trkC receptor mRNA in rat forebrain and association with high-affinity binding of [125I]BDNF, [125I]NT-4/5 and [125I]NT-3. Eur J Neurosci. 1994;6:1389–1405. - PubMed
    1. Altar CA, Cai N, Bliven T, Juhasz M, Conner JM, Acheson AL, Lindsay RM, Wiegand SJ. Anterograde transport of brain-derived neurotrophic factor and its role in the brain. Nature. 1997;389:856–860. - PubMed
    1. Balkowiec A, Katz DM. Activity-dependent release of endogenous brain-derived neurotrophic factor from primary sensory neurons detected by ELISA in situ. J Neurosci. 2000;20:7417–7423. - PMC - PubMed
    1. Baquet ZC, Gorski JA, Jones KR. Early striatal dendrite deficits followed by neuron loss with advanced age in the absence of anterograde cortical brain-derived neurotrophic factor. J Neurosci. 2004;24:4250–4258. - PMC - PubMed
    1. Baquet ZC, Bickford PC, Jones KR. Brain-derived neurotrophic factor is required for the establishment of the proper number of dopaminergic neurons in the substantia nigra pars compacta. J Neurosci. 2005;25:6251–6259. - PMC - PubMed

Publication types

MeSH terms

Substances

LinkOut - more resources