Comparative Study
. 2010 Feb 3;30(5):1822-31.
doi: 10.1523/JNEUROSCI.2168-09.2010.

12-Lipoxygenase regulates hippocampal long-term potentiation by modulating L-type Ca2+ channels

Affiliations
Comparative Study

12-Lipoxygenase regulates hippocampal long-term potentiation by modulating L-type Ca2+ channels

Anthony J DeCostanzo et al. J Neurosci. .

Abstract

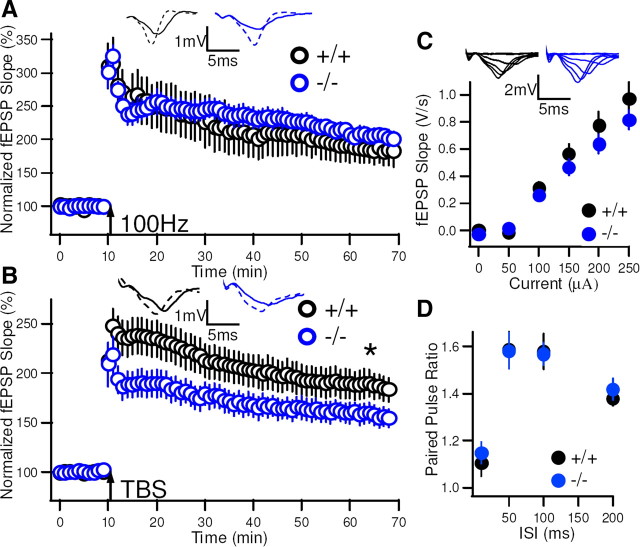
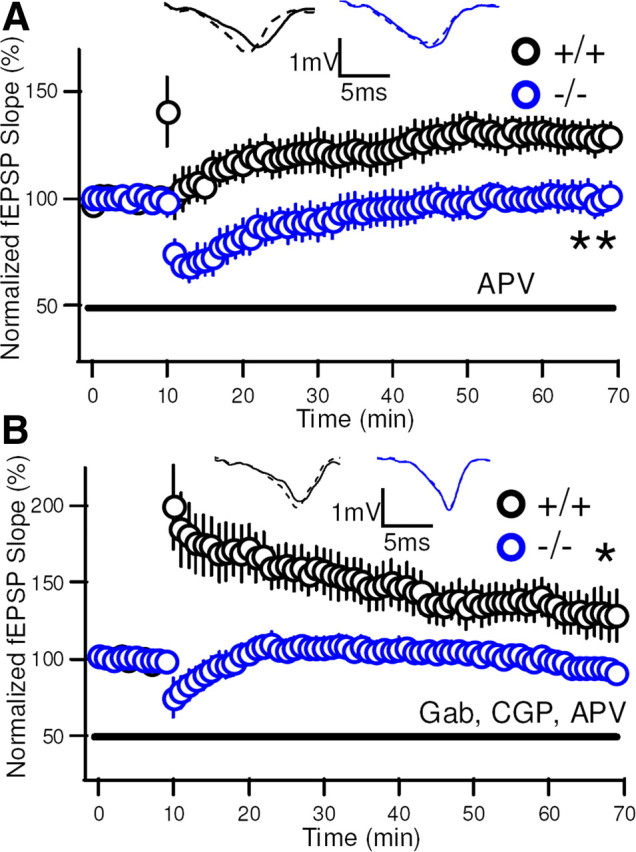
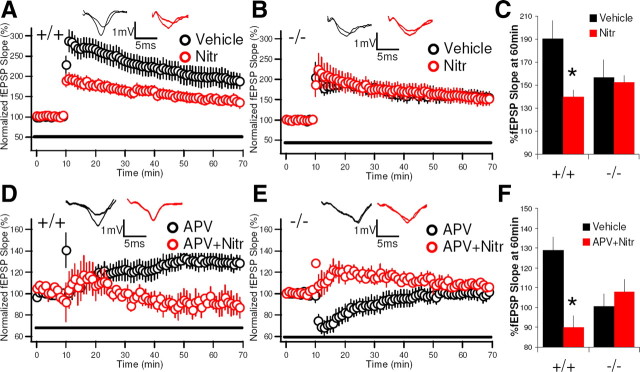
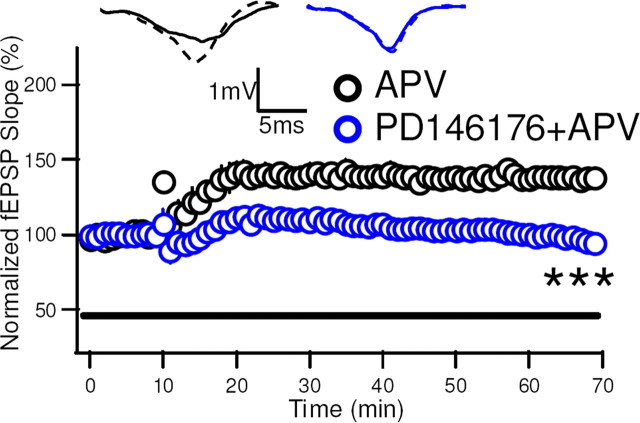
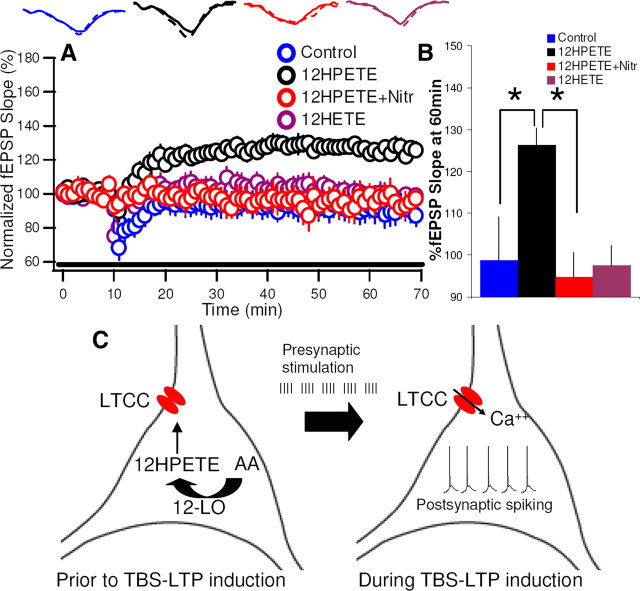
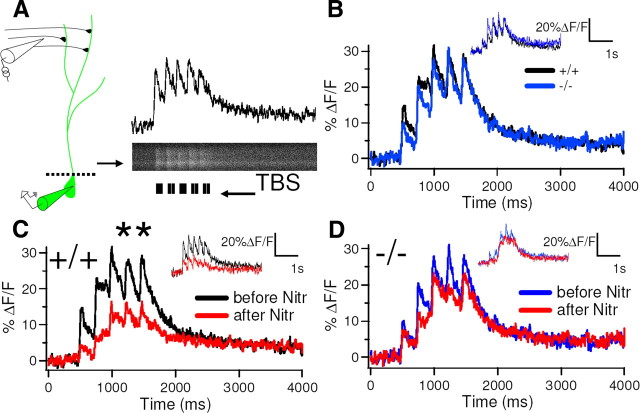
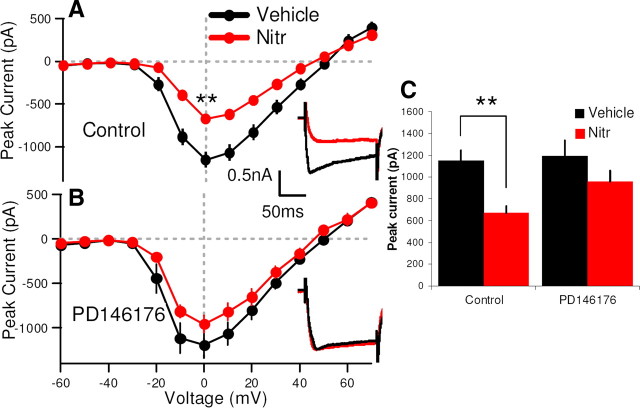
Although long-term potentiation (LTP) has been intensively studied, there is disagreement as to which molecules mediate and modulate LTP. This is partly attributable to the presence of mechanistically distinct forms of LTP that are induced by different patterns of stimulation and that depend on distinct Ca(2+) sources. Here, we report a novel role for the arachidonic acid-metabolizing enzyme 12-lipoxygenase (12-LO) in LTP at CA3-CA1 hippocampal synapses that is dependent on the pattern of tetanic stimulation. We find that 12-LO activity is required for the induction of LTP in response to a theta burst stimulation protocol that depends on Ca(2+) influx through both NMDA receptors and L-type voltage-gated Ca(2+) channels. In contrast, LTP induced by 100 Hz tetanic stimulation, which requires Ca(2+) influx through NMDA receptors but not L-type channels, does not require 12-LO. We find that 12-LO regulates LTP by enhancing postsynaptic somatodendritic Ca(2+) influx through L-type channels during theta burst stimulation, an action exerted via 12(S)-HPETE [12(S)-hydroperoxyeicosa-5Z,8Z,10E,14Z-tetraenoic acid], a downstream metabolite of 12-LO. These results help define the role of a long-disputed signaling enzyme in LTP.


Figures

Figure 1.
Figure 1.
Stimulus pattern-dependent deficit in LTP at CA3–CA1 synapses in 12-LO−/− mice. A, Four trains of 1-s-long 100 Hz stimulation (arrow) produced a similar amount of LTP in 12-LO+/+ (black) and 12-LO knock-out mice (blue), yielding 271 ± 33, 207 ± 33, and 183 ± 21% of baseline at 4, 30, and 60 min after the tetanus compared to 251 ± 14, 232 ± 16, and 205 ± 12% of initial fEPSP values in 12-LO−/− mice at corresponding time points (p = 0.7815 for between-genotype comparison with repeated-measures ANOVA). B, TBS (arrow) elicited LTP that was significantly different between slices from 12-LO+/+ (black) and 12-LO−/− (blue) mice, yielding 238 ± 17, 202 ± 15, and 187 ± 13% in 12-LO+/+ mice versus 185 ± 13, 167 ± 11, and 157 ± 10% of the baseline fEPSP measured at 4, 30, and 60 min after induction (p = 0.048 with main effect of genotype with repeated-measures ANOVA). Insets for A and B show sample fEPSP traces before (solid line) and 60 min after (dashed line) LTP induction. C, Basal synaptic transmission did not differ between 12-LO+/+ (black) and 12-LO−/− (blue) mice. Input–output relationship plotting fEPSP slope versus stimulating current strength. The inset shows sample fEPSPs. Fifty percent of the maximal test stimulation yielded similar fEPSP slopes between genotypes (p = 0.351 with unpaired Student's t test), as did the maximum stimulation intensity (p = 0.58 with unpaired Student's t test). D, Paired-pulse ratios (PPRs) were similar between genotypes. Pairs of stimuli were delivered at given interstimulus intervals. PPRs were obtained by dividing fEPSP slope in response to second pulse by fEPSP slope in response to first pulse. With unpaired Student's t test between genotypes at 10, 50, 100, and 200 ms interstimulus intervals, p values were 0.36, 0.85, 0.90, and 0.50, respectively. Error bars represent ±SEM. The asterisks indicate significance level.
Figure 2.
Figure 2.
NMDAR-independent LTP is abolished in 12-LO−/− mice. A, LTP was induced using TBS in slices from 12-LO+/+ and 12-LO−/− mice in the presence of 50 μm d-APV to block NMDA receptors. Slices from 12-LO+/+ mice (black) exhibited a potentiation of 129 ± 6.82% (n = 9) relative to baseline; slices from 12-LO−/− mice (blue) showed no potentiation, with fEPSP after TBS equal to 100 ± 6.50% of baseline (n = 9; p = 0.021, with ANOVA, Tukey's post hoc). Note transient depression seen in slices from 12-LO-deficient mice. B, The effect of 12-LO deletion to inhibit NMDAR-independent LTP does not depend on inhibitory synaptic transmission. The protocol described in A was repeated in the presence of 2 μm gabazine (Gab), a GABAA receptor antagonist, and 4 μm CGP55845 (CGP), a GABAB receptor antagonist. In the presence of APV, Gab, and CGP, TBS enhanced the fEPSP to 129 ± 15.7% (n = 6; black) of baseline in 12-LO+/+ mice but had no potentiating effect in 12-LO−/− mice, with fEPSP equal to 93 ± 6.15% (n = 9; blue) of baseline (p = 0.030, with unpaired Student's t test). The black horizontal bars indicate presence of drugs. Insets show sample fEPSP traces before (solid line) and 60 min after (dashed line) LTP induction. Error bars represent ±SEM. The asterisks indicate significance level.
Figure 3.
Figure 3.
L-type Ca2+ channel-dependent LTP is selectively abolished in 12-LO−/− mice. A–C, LTP was induced using TBS in slices from 12-LO+/+ and 12-LO−/− mice in the presence or absence of 20 μm Nitr to determine the proportion of potentiation that corresponded to LTCC-dependent LTP. A, C, In 12-LO+/+ mice, TBS enhanced fEPSP to 190 ± 19.5% (n = 7) of baseline in the absence of Nitr (black) versus 140 ± 12.0% (n = 7) in presence of Nitr (red; p = 0.046). B, C, However, in knock-out (−/−) mice, TBS enhanced fEPSP to 156 ± 15.2% (n = 7) and 152 ± 16% (n = 7) of baseline values in the absence (black) and presence (red) of Nitr, respectively (p = 0.84). Comparisons were made with Student's t test. D–F, The same protocol described above was used, but in the continuous presence of d-APV to isolate the LTCC-dependent component of LTP. The presence of d-APV revealed the NMDAR-independent component of TBS-LTP, which was fully blocked by Nitr. D, F, In 12-LO+/+ mice, TBS enhanced the fEPSP to 129 ± 6.8% (n = 9) and 90 ± 10.0% (n = 3) of its initial value in the absence (black) and presence (red) of Nitr, respectively (p = 0.026). E, F, In slices from 12-LO−/− mice, the fEPSP was unchanged by TBS, either in the absence (black; fEPSP equal to 100 ± 6.5% of baseline; n = 9) or in the presence of Nitr (red; fEPSP equal to 108 ± 3.2% of baseline; n = 3; p = 0.931). Comparisons were made with ANOVA, Tukey's post hoc comparison. LTP data from wild-type mice in presence of d-APV and absence of Nitr in D and F are replotted from Figure 2. The bar graphs show change in fEPSP slope 60 min after TBS stimulation, measured as means of the last five data points (5 min). Insets for A, B, D, and E show sample fEPSP traces before (solid line) and 60 min after (dashed line) LTP induction. Error bars represent ±SEM. The asterisks indicate significance level.
Figure 4.
Figure 4.
Pharmacological blockade of 12-LO abolishes LTCC-LTP. LTCC-dependent TBS-LTP in wild-type mice studied in the continuous presence of 50 μm d-APV was fully inhibited by 10 μm PD146176. Slices were preincubated in PD146716 for 2.5 h before experiment. Mean fEPSP amplitude was measured as percentage of baseline, averaged over a 5 min window 60 min after TBS. TBS in presence of d-APV (black) enhanced the fEPSP to 138 ± 3.45% of baseline (n = 5). In the presence of PD146176 plus d-APV (blue), TBS caused no significant change in fEPSP over baseline (96.6 ± 6.37%; n = 6; p < 0.0005 with unpaired Student's t test). The black bar indicates presence of drugs. Inset shows sample fEPSP traces before (solid line) and 60 min after (dashed line) LTP induction. Error bars represent ±SEM. The asterisks indicate significance level.
Figure 5.
Figure 5.
The 12-LO metabolite 12(S)-HPETE rescues LTCC-dependent LTP from pharmacological blockade of 12-LO. A, Effects of application of 12-LO metabolites on induction of NMDAR-independent TBS-LTP in slices in which 12-LO was blocked by 10 μm PD146176 (PD). d-APV (50 μm) was also present to block NMDARs. Shown is the effect TBS delivered in the absence of 12(S)-HPETE (blue), in the presence of 250 nm 12(S)-HPETE (black), in the presence of 250 nm 12(S)-HPETE and 20 μM Nitr (red), and in the presence of 250 nm 12(S)-HETE (purple). The black bar indicates presence of drugs. Insets show sample fEPSP traces before (solid line) and 60 min after (dashed line) LTP induction. B, Bar graph representing LTP measured as mean fEPSP during 5 min window 60 min after TBS expressed as percentage of baseline fEPSP before TBS. LTP was equal to 98.7 ± 10.4, 126.3 ± 3.96, 94.7 ± 5.9, and 97.5 ± 4.7% for control (no 12-LO metabolite) (n = 6), 250 nm 12(S)-HPETE (n = 10), 250 nm 12(S)-HPETE plus Nitr (n = 5), and 250 nm 12(S)-HETE (n = 7), respectively. Values of p were 0.0147 for PD plus APV versus PD plus APV plus 12(S)-HPETE, 0.97 for PD plus APV versus PD plus APV plus 12(S)-HPETE plus Nitr, 0.99 for PD plus APV versus PD plus APV plus 12(S)-HETE, 0.0077 for PD plus APV plus 12(S)-HPETE versus PD plus APV plus 12(S)-HPETE plus Nitr. Comparisons were made with ANOVA and Tukey's post hoc test. Error bars represent ±SEM. The asterisks indicate significance level. C, Model for 12-LO priming of induction of LTCC-dependent LTP. Basal 12-LO activity before TBS produces 12(S)-HPETE, thereby enabling LTCC activity and priming future induction of LTP. When TBS is applied, depolarization from postsynaptic spiking results in LTCC channel opening, and this Ca2+ influx induces LTP.
Figure 6.
Figure 6.
Somatodendritic Ca2+ influx through LTCCs in response to a theta burst is impaired in CA1 pyramidal neurons of 12-LO−/− mice. The intracellular Ca2+ signal in response to a theta burst stimulation was assessed with two-photon microscopy to determine the percentage of Ca2+ influx entering through L-type Ca2+ channels. A, Schematic of experimental setup. CA1 pyramidal neurons were loaded with Ca2+ dye using whole-cell patch recordings with a pipette filled with 200 μm Fluo-4. After dye loading, the patch pipette was removed from the cell to prevent extensive dialysis. The Schaffer collaterals were stimulated with a theta burst during line scan imaging across the proximal dendrite near the soma (dashed line). The inset shows a typical fluorescence trace in response to five bursts of stimuli at 5 Hz with each burst consisting of 10 spikes delivered at 100 Hz. Bottom, Raw line scan fluorescence. Top, Profile of average fluorescence signal across line during TBS. B, Mean plots of Ca2+ transient in response to TBS between 12-LO+/+ (black; n = 5; black trace) and 12-LO−/− (blue; n = 5; blue trace) mice. Ca2+ signal was calculated as area under the curves between 500 ms (start of TBS) to 2.5 s. TBS yielded an integral of 27 ± 5.56 s · % (n = 5) in CA1 neurons from 12-LO+/+ mice versus 24.2 ± 4.83 s · % (n = 5) in neurons from 12-LO−/− mice (p = 0.71 with Student's unpaired t test). C, Mean plots of Ca2+ transient in CA1 neurons from 12-LO+/+ mice before (black trace, n = 5) and after (red trace, n = 5) application of 20 μm Nitr. D, Mean plots of Ca2+ transient in CA1 neurons from 12-LO−/− pyramidal neurons before (blue trace; n = 5) and after (red trace; n = 5) 20 μm Nitr. Nitr blocked 58.8 ± 6.3% (n = 5) of the TBS-induced Ca2+ signal in pyramidal neurons from wild-type mice versus 23.5 ± 8.1% (n = 5) in neurons from 12-LO−/− mice (p = 0.0063 with Student's unpaired t test). Insets show sample Ca+ transients. The asterisks indicate significance level.
Figure 7.
Figure 7.
Pharmacological blockade of 12-LO reduces the macroscopic LTCC current in CA1 pyramidal neurons. A, Whole-cell current–voltage relationships measured in the absence and presence of Nitr. Peak currents were measured for 200-ms-long voltage steps. Difference in curves in absence (black) and presence of Nitr (red) represents contribution of L-type Ca2+ channels. Inset, Representative current traces shown during step to 0 mV. B, Whole-cell current–voltage relationships in absence (black) and presence (red) of Nitr with 12-LO blocked in continuous presence of 10 μm PD146176. All measurements were performed in the presence of 0.05% DMSO, the solvent for Nitr. The inset depicts representative currents in the presence of PD146716 with and without Nitr. C, Bar graph showing peak inward current of I–V plots in A and B during depolarization to 0 mV. Control, I–V data in absence of PD146176. Peak inward current was 1151 ± 94 pA in absence (black) of Nitr (n = 14) versus 671 ± 59 pA (n = 18) in presence (red) of Nitr (p = 0.00123). PD146176, I–V data in presence of 12-LO inhibitor. Peak inward current was 1192 ± 142 pA in absence (black) of Nitr (n = 7) versus 958 ± 98 pA in presence (red) of Nitr (n = 13) (p = 0.564). Comparisons are based on ANOVA with Tukey's post hoc comparison. Error bars represent ±SEM. The asterisks indicate significance level.

Similar articles

Cited by

References

    1. Besana A, Robinson RB, Feinmark SJ. Lipids and two-pore domain K+ channels in excitable cells. Prostaglandins Other Lipid Mediat. 2005;77:103–110. - PubMed
    1. Bliss TV, Collingridge GL, Morris RG. Introduction. Long-term potentiation and structure of the issue. Philos Trans R Soc Lond B Biol Sci. 2003;358:607–611. - PMC - PubMed
    1. Borroni AM, Fichtenholtz H, Woodside BL, Teyler TJ. Role of voltage-dependent calcium channel long-term potentiation (LTP) and NMDA LTP in spatial memory. J Neurosci. 2000;20:9272–9276. - PMC - PubMed
    1. Buttner N, Siegelbaum SA, Volterra A. Direct modulation of Aplysia S-K+ channels by a 12-lipoxygenase metabolite of arachidonic acid. Nature. 1989;342:553–555. - PubMed
    1. Carlson G, Wang Y, Alger BE. Endocannabinoids facilitate the induction of LTP in the hippocampus. Nat Neurosci. 2002;5:723–724. - PubMed

Publication types

Substances