

Synaptic mechanisms of direction selectivity in primary auditory cortex
- PMID: 20130195
- PMCID: PMC2833018
- DOI: 10.1523/JNEUROSCI.3088-09.2010
Synaptic mechanisms of direction selectivity in primary auditory cortex
Abstract
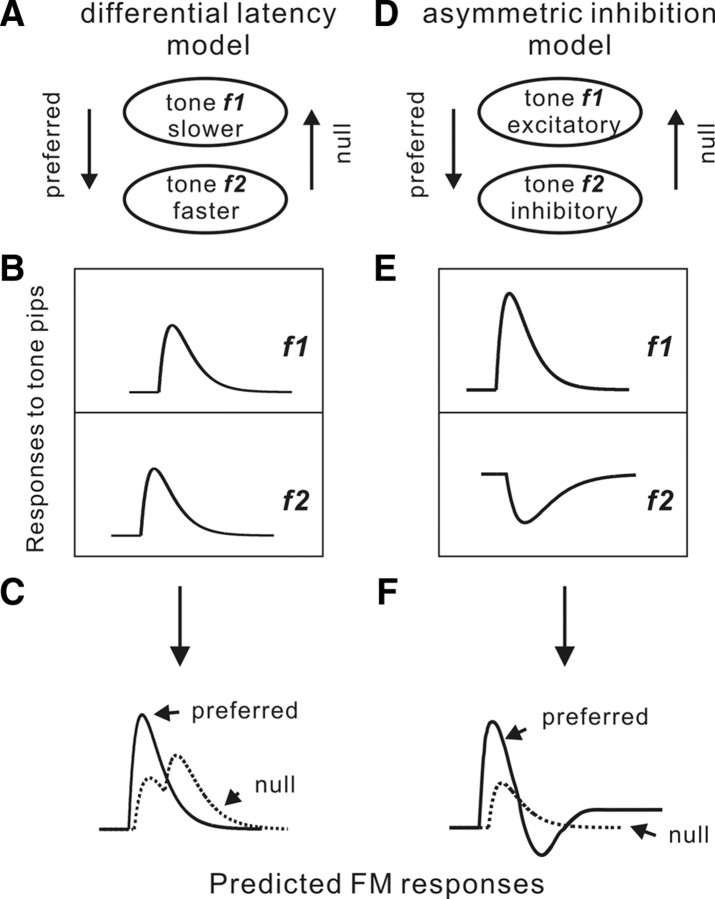
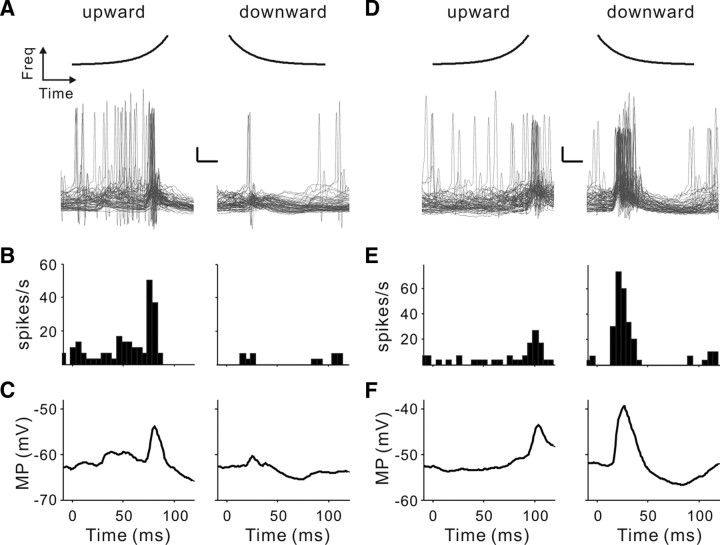
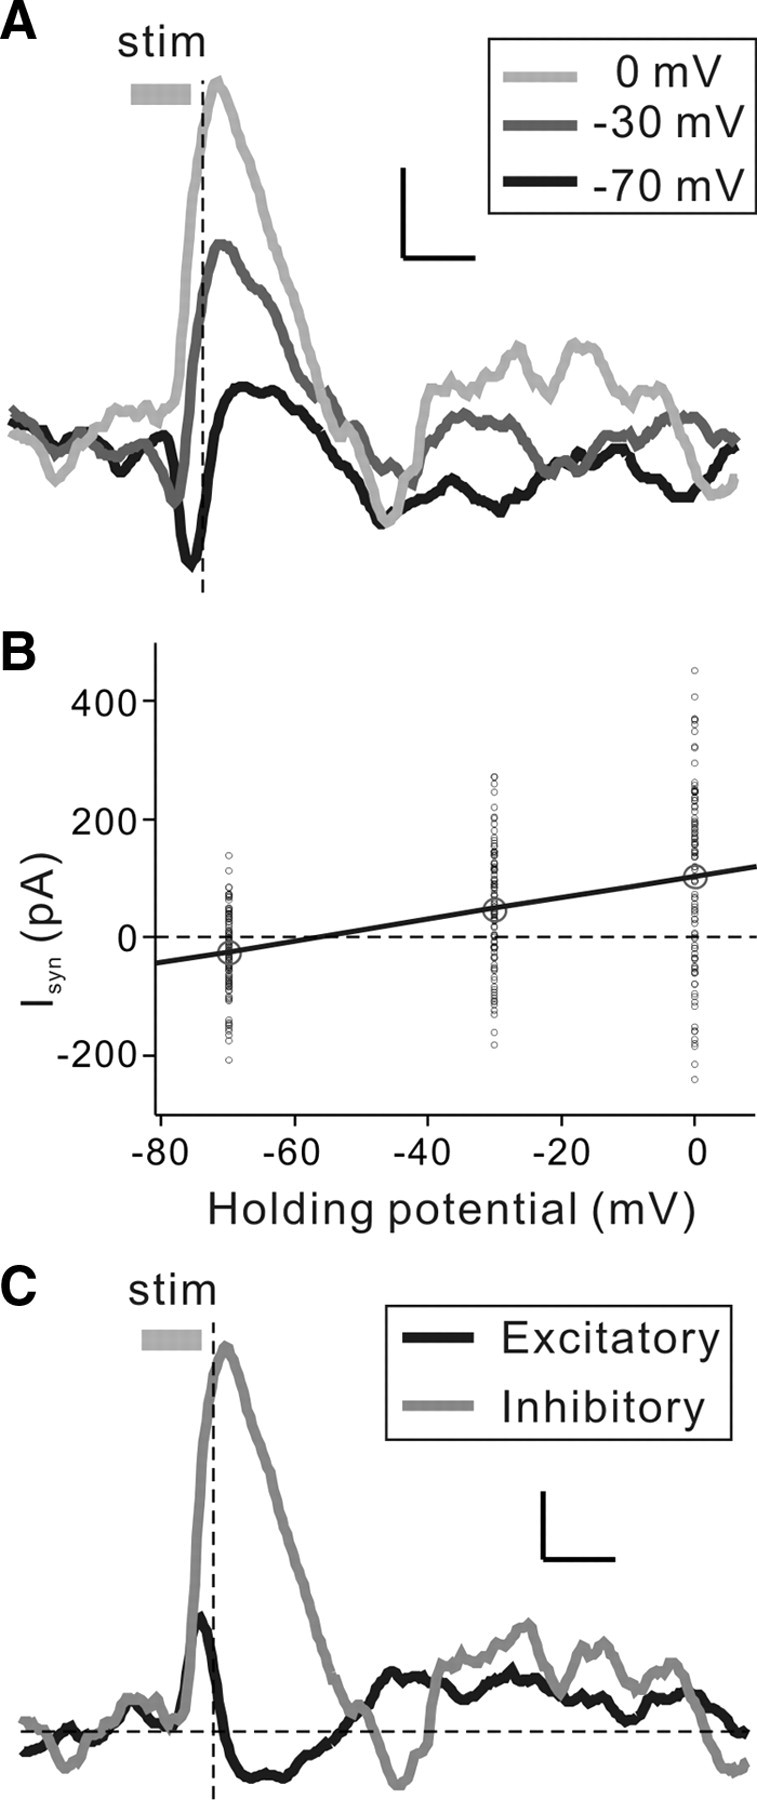
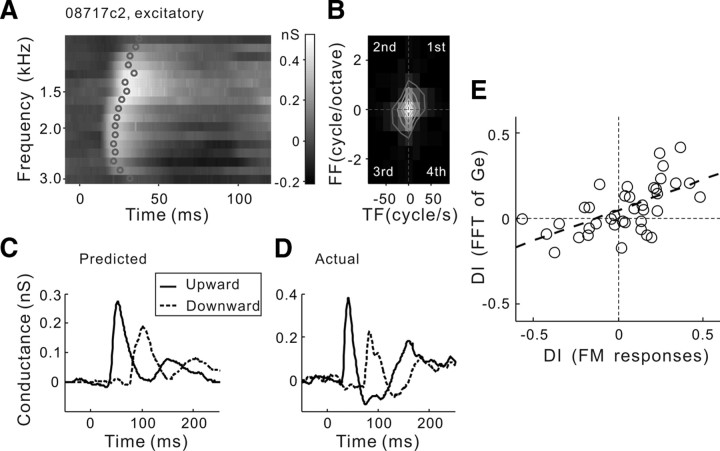
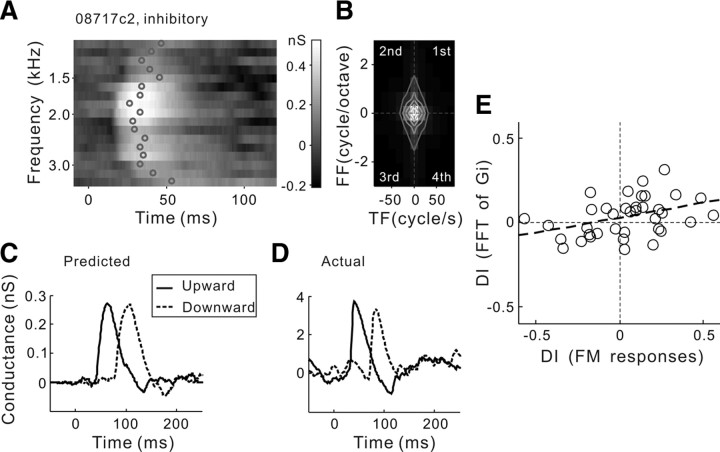
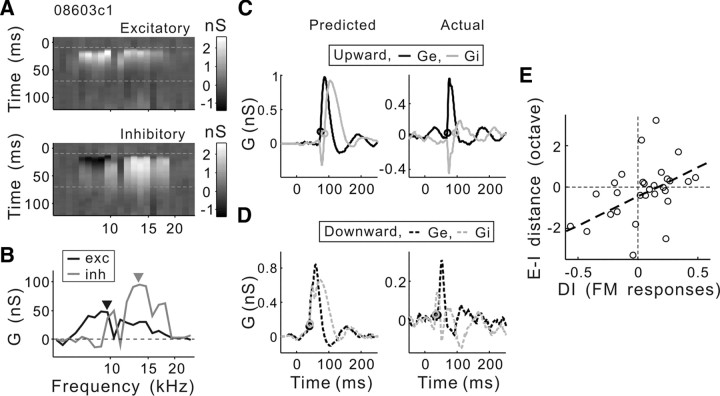
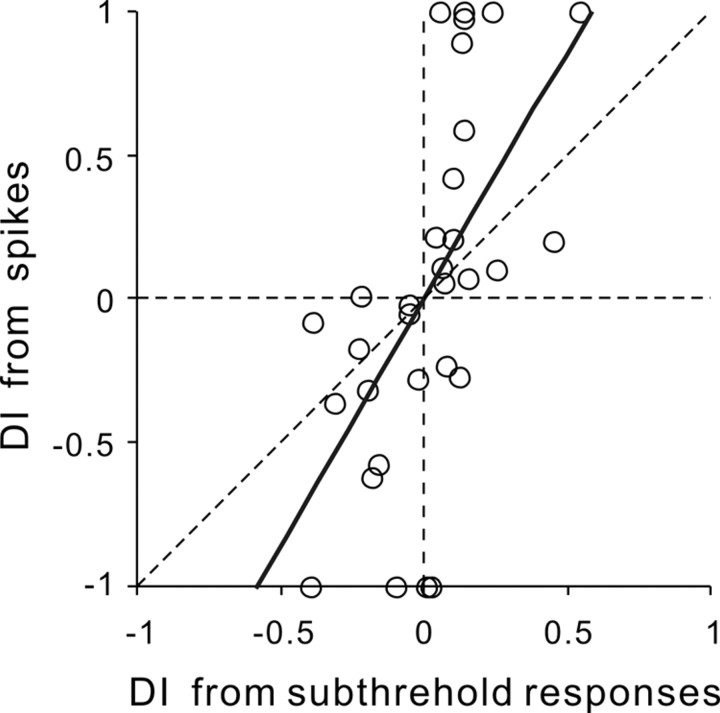
Frequency modulation (FM) is a prominent feature in animal vocalization and human speech. Although many neurons in the auditory cortex are known to be selective for FM direction, the synaptic mechanisms underlying this selectivity are not well understood. Previous studies of both visual and auditory neurons have suggested two general mechanisms for direction selectivity: (1) differential delays of excitatory inputs across the spatial/spectral receptive field and (2) spatial/spectral offset between excitatory and inhibitory inputs. In this study, we have examined the contributions of both mechanisms to FM direction selectivity in rat primary auditory cortex. The excitatory and inhibitory synaptic inputs to each cortical neuron were measured by in vivo whole-cell recording. The spectrotemporal receptive field of each type of inputs was mapped with random tone pips and compared with direction selectivity of the neuron measured with FM stimuli. We found that both the differential delay of the excitatory input and the spectral offset between excitation and inhibition are positively correlated with direction selectivity of the neuron. Thus, both synaptic mechanisms are likely to contribute to FM direction selectivity in the auditory cortex. Finally, direction selectivity measured from the spiking output is significantly stronger than that based on the subthreshold membrane potentials, indicating that the selectivity is further sharpened by the spike generation mechanism.
Figures
Similar articles
-
Balance or imbalance: inhibitory circuits for direction selectivity in the auditory system.Cell Mol Life Sci. 2015 May;72(10):1893-906. doi: 10.1007/s00018-015-1841-2. Epub 2015 Feb 1. Cell Mol Life Sci. 2015. PMID: 25638210 Free PMC article. Review.
-
Topography and synaptic shaping of direction selectivity in primary auditory cortex.Nature. 2003 Jul 10;424(6945):201-5. doi: 10.1038/nature01796. Nature. 2003. PMID: 12853959
-
Selective Strengthening of Intracortical Excitatory Input Leads to Receptive Field Refinement during Auditory Cortical Development.J Neurosci. 2019 Feb 13;39(7):1195-1205. doi: 10.1523/JNEUROSCI.2492-18.2018. Epub 2018 Dec 26. J Neurosci. 2019. PMID: 30587538 Free PMC article.
-
Network models of frequency modulated sweep detection.PLoS One. 2014 Dec 16;9(12):e115196. doi: 10.1371/journal.pone.0115196. eCollection 2014. PLoS One. 2014. PMID: 25514021 Free PMC article.
-
Experience-dependent development of vocalization selectivity in the auditory cortex.J Acoust Soc Am. 2010 Sep;128(3):1446-51. doi: 10.1121/1.3377057. J Acoust Soc Am. 2010. PMID: 20815478 Free PMC article. Review.
Cited by
-
Balance or imbalance: inhibitory circuits for direction selectivity in the auditory system.Cell Mol Life Sci. 2015 May;72(10):1893-906. doi: 10.1007/s00018-015-1841-2. Epub 2015 Feb 1. Cell Mol Life Sci. 2015. PMID: 25638210 Free PMC article. Review.
-
Multisensory perceptual interactions between higher-order temporal frequency signals.J Exp Psychol Gen. 2019 Jul;148(7):1124-1137. doi: 10.1037/xge0000513. Epub 2018 Oct 18. J Exp Psychol Gen. 2019. PMID: 30335446 Free PMC article.
-
Retinal direction selectivity in the absence of asymmetric starburst amacrine cell responses.Elife. 2019 Feb 4;8:e42392. doi: 10.7554/eLife.42392. Elife. 2019. PMID: 30714905 Free PMC article.
-
Recurrent network dynamics shape direction selectivity in primary auditory cortex.Nat Commun. 2021 Jan 12;12(1):314. doi: 10.1038/s41467-020-20590-6. Nat Commun. 2021. PMID: 33436635 Free PMC article.
-
Inhibition shapes response selectivity in the inferior colliculus by gain modulation.Front Neural Circuits. 2012 Sep 18;6:67. doi: 10.3389/fncir.2012.00067. eCollection 2012. Front Neural Circuits. 2012. PMID: 23024629 Free PMC article.
References
-
- Adelson EH, Bergen JR. Spatiotemporal energy models for the perception of motion. J Opt Soc Am A. 1985;2:284–299. - PubMed
-
- Atencio CA, Blake DT, Strata F, Cheung SW, Merzenich MM, Schreiner CE. Frequency-modulation encoding in the primary auditory cortex of the awake owl monkey. J Neurophysiol. 2007;98:2182–2195. - PubMed
-
- Baker CL., Jr Linear filtering and nonlinear interactions in direction-selective visual cortex neurons: a noise correlation analysis. Vis Neurosci. 2001;18:465–485. - PubMed
-
- Barry PH. JPCalc, a software package for calculating liquid junction potential corrections in patch-clamp, intracellular, epithelial and bilayer measurements and for correcting junction potential measurements. J Neurosci Methods. 1994;51:107–116. - PubMed
Publication types
MeSH terms
Grants and funding
LinkOut - more resources
Full Text Sources