. 2010 Feb 3;30(5):1869-81.
doi: 10.1523/JNEUROSCI.4701-09.2010.

Presynaptic mitochondria in functionally different motor neurons exhibit similar affinities for Ca2+ but exert little influence as Ca2+ buffers at nerve firing rates in situ

Affiliations

Presynaptic mitochondria in functionally different motor neurons exhibit similar affinities for Ca2+ but exert little influence as Ca2+ buffers at nerve firing rates in situ

Amit K Chouhan et al. J Neurosci. .

Abstract

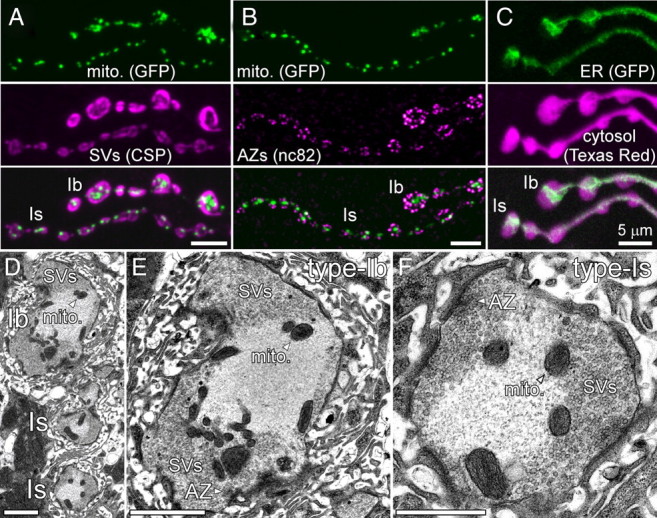
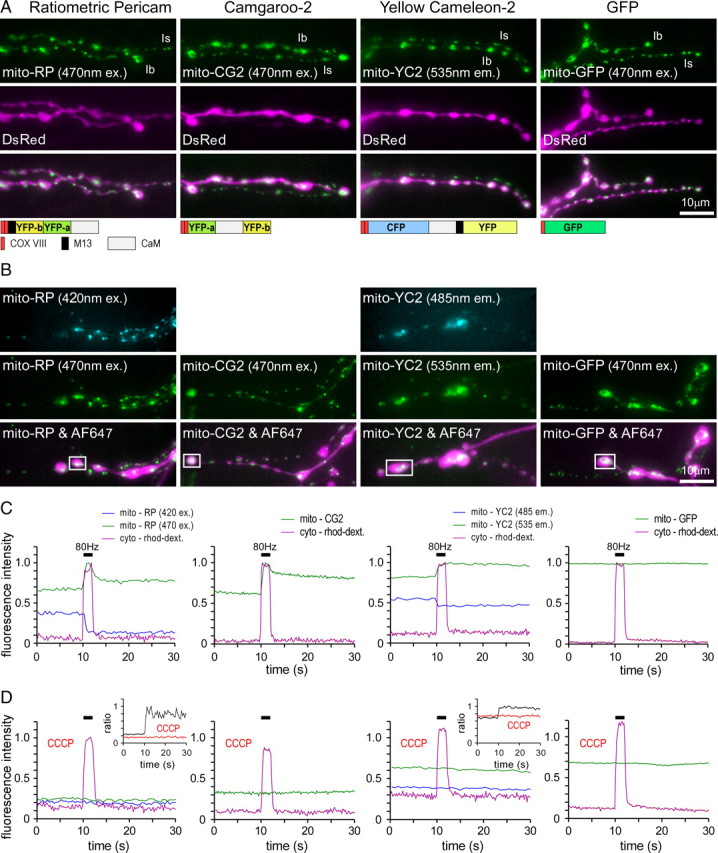
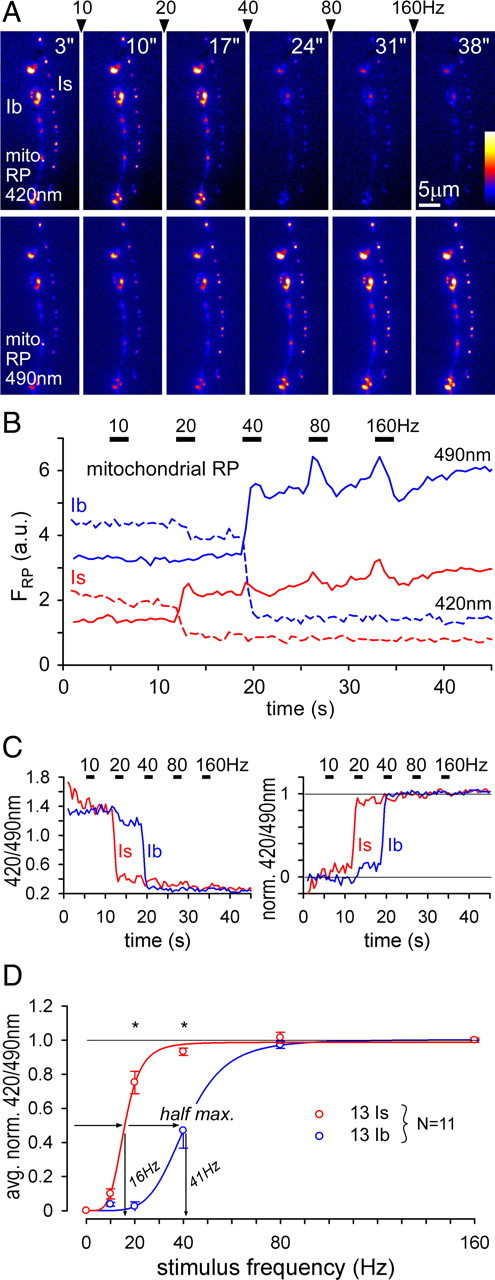
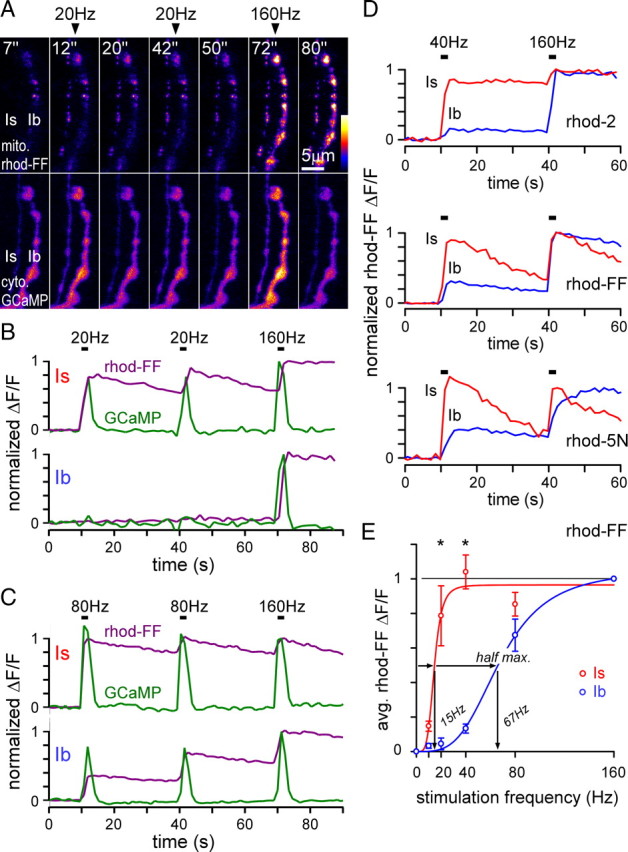
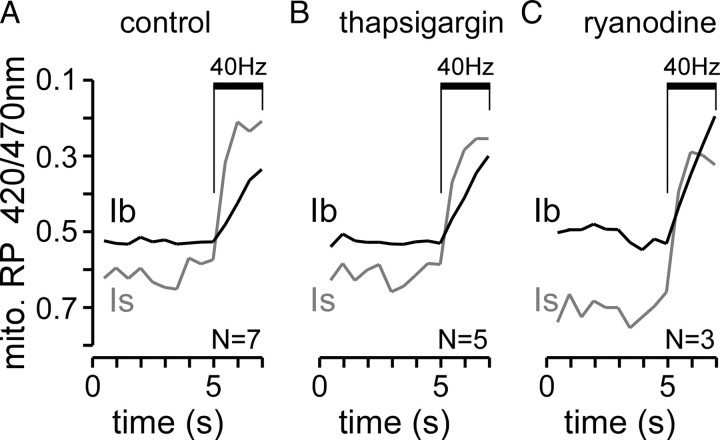
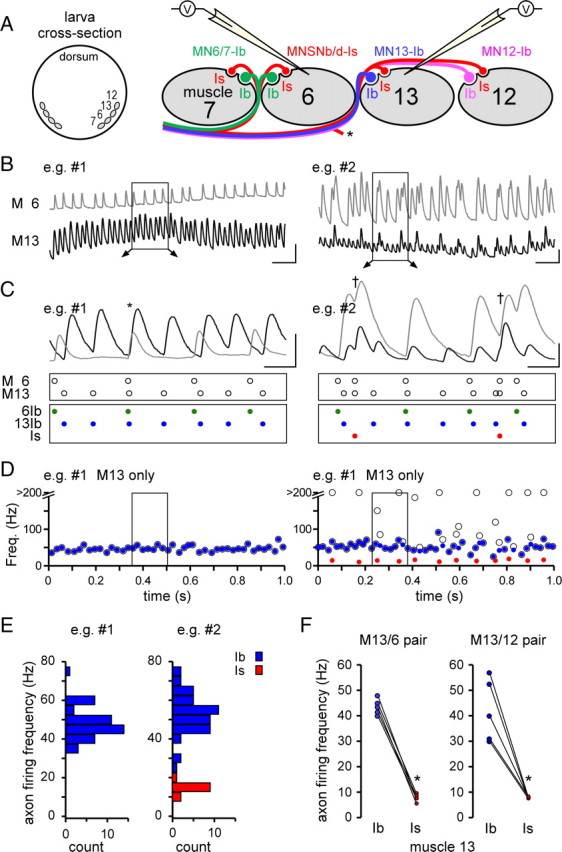
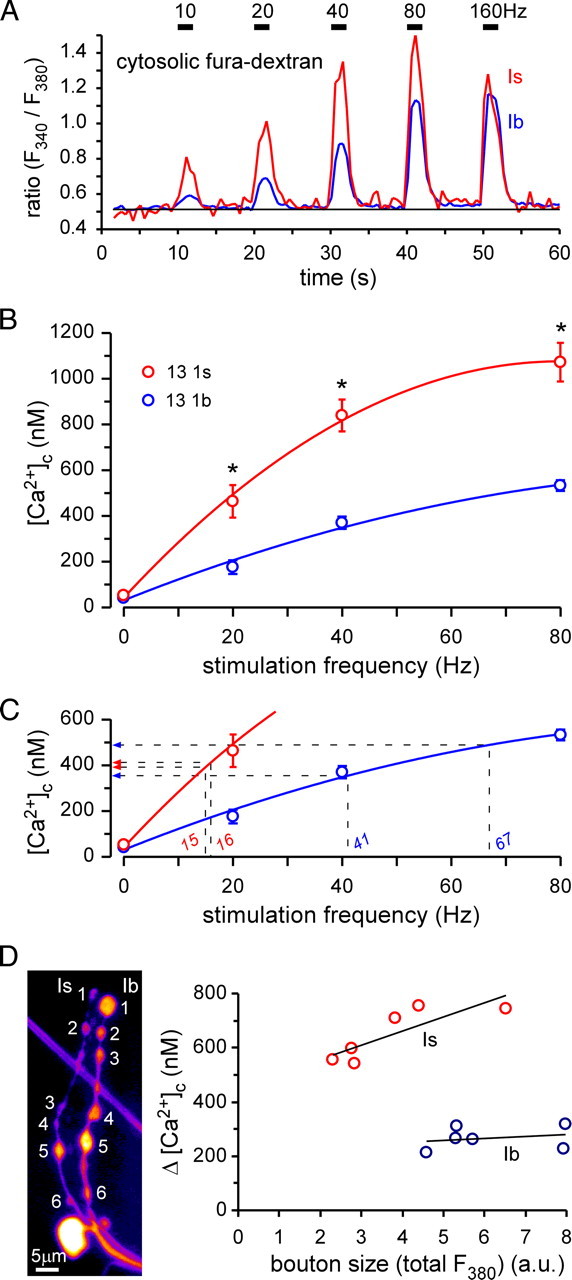
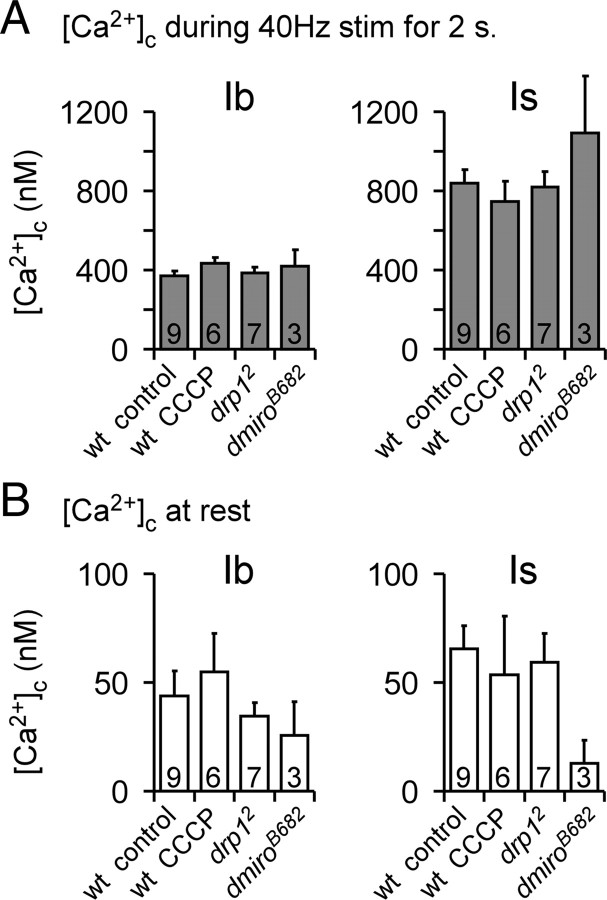
Mitochondria accumulate within nerve terminals and support synaptic function, most notably through ATP production. They can also sequester Ca(2+) during nerve stimulation, but it is unknown whether this limits presynaptic Ca(2+) levels at physiological nerve firing rates. Similarly, it is unclear whether mitochondrial Ca(2+) sequestration differs between functionally different nerve terminals. We addressed these questions using a combination of synthetic and genetically encoded Ca(2+) indicators to examine cytosolic and mitochondrial Ca(2+) levels in presynaptic terminals of tonic (MN13-Ib) and phasic (MNSNb/d-Is) motor neurons in Drosophila, which, as we determined, fire during fictive locomotion at approximately 42 Hz and approximately 8 Hz, respectively. Mitochondrial Ca(2+) sequestration starts in both terminals at approximately 250 nM, exhibits a similar Ca(2+)-uptake affinity (approximately 410 nM), and does not require Ca(2+) release from the endoplasmic reticulum. Nonetheless, mitochondrial Ca(2+) uptake in type Is terminals is more responsive to low-frequency nerve stimulation and this is due to higher cytosolic Ca(2+) levels. Since type Ib terminals have a higher mitochondrial density than Is terminals, it seemed possible that greater mitochondrial Ca(2+) sequestration may be responsible for the lower cytosolic Ca(2+) levels in Ib terminals. However, genetic and pharmacological manipulations of mitochondrial Ca(2+) uptake did not significantly alter nerve-stimulated elevations in cytosolic Ca(2+) levels in either terminal type within physiologically relevant rates of stimulation. Our findings indicate that presynaptic mitochondria have a similar affinity for Ca(2+) in functionally different nerve terminals, but do not limit cytosolic Ca(2+) levels within the range of motor neuron firing rates in situ.


Figures

Figure 1.
Figure 1.
Distribution of mitochondria and the ER in larval Drosophila MN terminals. A, Confocal microscopy images of type Ib and Is terminals on muscle 6 immunolabeled for mito-GFP (green) and CSP of synaptic vesicles (SVs; magenta). Mito-GFP was expressed in MNs with the OK6-Gal4 driver. B, Confocal images of terminals immunolabeled for mito-GFP (green) and Brp (stained with antibody nc82) that is found in active zones (AZs; magenta). C, Confocal image of the ER in type Ib and Is terminals labeled by OK6-Gal4-driven expression of ER-GFP (Lyso-GFP-KDEL; green). The MN was visualized by filling the cytosol with Texas Red dextran (magenta). Note that the ER-GFP fluorescence suggests a continuous ER system throughout all boutons. Scale bars (A–C), 5 μm. D–F, Electron micrographs showing cross-sections of type Is and Ib boutons in overview (D) and in higher magnification (E, F). Mitochondria are mostly found at the interface between a central synaptic vesicle-free and a peripheral synaptic vesicle-rich region of Is and Ib boutons. Active zones with or without T-bars are indicated. Scale bars (D, E, F), 2, 2, and 1 μm, respectively.
Figure 2.
Figure 2.
GECIs targeted to mitochondria report mitochondrial Ca2+ uptake in response to nerve stimulation. A, Fluorescence images (wide-field microscopy) showing OK6-driven expression of ratiometric mito-RP, mito-CG2, mito-YC2, and mito-GFP in type Is and Ib MN terminals on muscle 13 (top row) that were filled with cytosolic DsRed (second row). The inset below shows the basic design of each GECI. B, Fluorescence images of mito-RP, mito-CG2, mito-YC2, and mito-GFP in terminals (two top rows) filled with AF647-dextran and rhod-dextran (bottom row). Mito-RP fluorescence (520 nm emission) was excited alternately at 420 and 470 nm, mito-YC2 fluorescence (485 and 535 nm emission) was excited at 440 nm, and CG2 fluorescence (520 nm emission) and mito-GFP fluorescence (520 nm emission) was excited at 470 nm. C, D, Changes in fluorescence (boxed regions in B) in response to nerve stimulation (80 Hz, 2 s) in the absence (C) and presence (D) of the protonophore CCCP. Changes in the fluorescence of mito-RP, mito-CG2, and mito-YC2 were only observed in the absence of 3 μm CCCP, and showed little delay relative to changes in fluorescence of the cytosolic Ca2+ indicator rhod-dextran. The maximum fluorescence responses of rhod-dextran and the GECIs were normalized to a value of 1 (C), and the same scaling factors were used after application of CCCP (D). As expected, mito-GFP showed no response to nerve stimulation.
Figure 3.
Figure 3.
GECIs reveal differences in mitochondrial Ca2+ uptake between terminals of MN13-Ib and MNSNb/d-Is. A, Images of mito-RP fluorescence before and after successive nerve stimulus trials (left to right: stimulation frequency indicated between frames) from type Ib and Is terminals on muscle 13. Mito-RP fluorescence was collected through a 520/35 nm filter during sequential 420 nm (top panel) and 490 nm (bottom panel) excitation. B, Plot of nerve stimulation-induced changes in mito-RP fluorescence (from A). The 490ex/520em mito-RP fluorescence increased while 420ex/520em fluorescence decreased in response to 10, 20, 40, 60, and 160 Hz stimulus trains (2 s each). In contrast to 420ex/520em fluorescence, 490ex/520em fluorescence decreased when stimulation ceased, and the transient is likely due to changes in superoxide anion concentration (see Results). Images were captured at 2 frames per second for each excitation wavelength. C, Left panel: Plot of the mito-RP emission intensity ratios (420/490 nm excitation) for the terminals shown above (A, B). Right panel: Plot of the reciprocal mito-RP emission intensity ratio normalized to a value of 0 before the first train (t = 3 s) and a maximum response of 1 after the last train (t = 38 s), i.e., inverted relative to the left panel. D, Average mito-RP ratio responses plotted against the frequency of stimulation for type Ib and Is terminals on muscle 13 (n = 11). Sigmoidal curve fits were made using the Hill equation (SigmaPlot 10, Systat Software Inc.), which was used to estimate half-maximal values shown. Asterisks indicate highly significant differences (p < 0.001) between type Ib and Is responses in pairwise comparisons (two-way ANOVA, p < 0.05 overall, Tukey post hoc test). Error bars indicate SEM.
Figure 4.
Figure 4.
Synthetic Ca2+-indicators confirm differences in nerve stimulation-dependent mitochondrial Ca2+ uptake between terminals types. A, Fluorescence from mitochondrially localized rhod-FF (top panels) and cytosolic GCaMP1.3 (bottom panels, expression driven by OK6-Gal4) in type Is and Ib terminals on muscle 13 before, during, and after the indicated stimulus trains. B, Typical plots of nerve-stimulated (20 and 160 Hz) changes in rhod-FF and GCaMP fluorescence from the terminals in A. The ΔF/F response to 160 Hz was assigned a value of 1 and all other values of ΔF/F were scaled in proportion. C, Typical plots of changes in rhod-FF and GCaMP fluorescence in response to 80 and 160 Hz nerve stimulation. D, Typical plots of nerve-stimulated (40 and 160 Hz) changes in the fluorescence of mitochondrially targeted rhod-2, rhod-FF, and rhod-5N in type Is and Ib terminals. E, Average change in rhod-FF fluorescence from Is and Ib terminals on muscle 13 in response to various stimulation frequencies (10, 20, 40, and 80 Hz) after normalizing individual responses (as in B and C). Sigmoidal curve fits were made using the Hill equation, which was used to estimate half-maximal values as shown. Significant differences are indicated (p < 0.001, N ≥ 6, two-way ANOVA, Holm-Sidak post hoc test). Error bars indicate SEM.
Figure 5.
Figure 5.
Mitochondrial Ca2+ uptake is not dependent on Ca2+ transfer from the ER. A–C, Plots of the average mito-RP fluorescence in type Ib and Is terminals on muscle 13 in response to nerve stimulation (40 Hz, 2 s). The mito-RP ratio (420/470) is shown on an inverted scale for untreated terminals (A) and terminals treated with 20 μm thapsigargin (B) or 100 μm ryanodine (C). The records are truncated at the end of the stimulus train, as treated preparations (≥30 min) commonly contracted at the end of each train. The numbers of terminal pairs examined are shown at the bottom of each plot.
Figure 6.
Figure 6.
Motor neurons MNSNb/d-Is and MN13-Ib fire at different frequencies during fictive locomotion. A, Left: Cross-sectional representation showing the location of larval body-wall muscles 7, 6, 13, and 12. Right: Representation of dual recording from muscles 13 and 6 and the pattern of MN innervation. MNSNb/d-Is forms type Is boutons on all muscle fibers while motor neurons MN6/7-Ib, MN13-Ib, and MN12-Ib form type Ib boutons on selected muscle fibers. The asterisk indicates another branch of the MNSNb/d-Is. B, Two example traces (left and right) of EJPs during fictive locomotion recorded simultaneously from adjacent muscles (6 and 13). Left: Traces showing synaptic activity from separate MNs (MN6/7-Ib and MN13-Ib) on the separate muscles. Right: Traces showing synaptic activity from MN6/7-Ib and MN13-Ib, in addition to periodic input from MNSNb/d-Is that innervates both muscles. Scale bars, 100 ms and 5 mV. C, EJP–MN relationship (from boxed sections in B). Open circles (in the boxes below the traces) denote the occurrence of each EJP according to the muscle in which it is detected. Color, filled circles (in the lowest boxes) identify the MN from which each EJP originates. Coincident events between traces can be attributed to chance, alone (*left), or a common innervating axon (MNSNb/d-Is, right). D, Plots of instantaneous EJP frequencies for muscle 13 from the example traces in B. The identity of each contributing MN is indicated: open circles, all EJPs before identification; blue circles, MN13-Ib EJPs; red circles, MNSNb/d-Is EJPs. Events occurring <3 ms apart could not be discriminated and were plotted with all other events with an instantaneous frequency of >200 Hz. E, Firing frequency distributions for the MNs producing the EJPs shown in D. F, Average maximum firing frequencies for MN13-Ib and MNSNb/d-Is (calculated during the most active 2 s period in each record). Each pair of connected circles represents estimates made from a different pair of muscle fibers, either 13 and 6 (left) or 13 and 12 (right). Asterisks indicate significance (p < 0.005) in paired t tests.
Figure 7.
Figure 7.
Nerve stimulation-dependent cytosolic Ca2+ levels are significantly different in type Is and Ib terminals. A, Changes in the ratio (340/380 nm) of fura-dextran fluorescence in response to nerve stimulation at 10, 20, 40, 80, and 160 Hz in MN13-Ib and MNSNb/d-Is terminals. Changes in the fura ratio can be calibrated and converted to changes in [Ca2+]c. B, Average [Ca2+]c in type Is and Ib terminals for each stimulation frequency. Data were fitted with a cubic spline. Asterisks indicate significant differences in pairwise comparisons (two-way ANOVA, p < 0.05 overall, Holm-Sidak post hoc test). Error bars indicate SEM. C, Same plot as in B but overlaid with projections of the half-maximal response frequencies of mito-RP and rhod-FF (Figs. 3D, 4E) from the abscissa to the ordinate. The corresponding values of [Ca2+]c are: MNSNb/d-Is, 412 nm (mito-RP), 391 nm (rhod-FF); MN13-Ib: 355 nm (mito-RP), 489 nm (rhod-FF). D, Plot of nerve stimulation-dependent (40 Hz, 2 s) changes in [Ca2+]c (Δ[Ca2+]c) for boutons of different sizes from type Is and Ib terminals (6 boutons from each terminal, as indicated in the image of fura-loaded MN terminals). There was no correlation between bouton size and Δ[Ca2+]c in either terminal (Spearman rank order correlation, p > 0.2).
Figure 8.
Figure 8.
Cytosolic Ca2+ levels ([Ca2+]c) in type Ib and Is terminals do not depend on the presence of functional mitochondria. A, Average [Ca2+]c in type Ib (left) and Is terminals (right) on muscle 13 in response to a 2 s 40 Hz stimulation train. Average [Ca2+]c is shown for the wild-type control (w1118), wild-type control exposed to 3 μm CCCP, and mutant terminals homozygous for drp12 or dmiroB682. The numbers of type Ib and Is terminal pairs are indicated in the bars. No difference was found within terminal type between control and CCCP, drp12, or dmiroB682. For each treatment, [Ca2+]c responses to nerve stimulation are significantly different between type Ib and Is terminals (two-way ANOVA, p < 0.05 overall, Holm-Sidak post hoc test). B, Average [Ca2+]c in the same terminals as in A before nerve stimulation. No significant differences were found within terminal type or between treatments (two-way ANOVA). Error bars indicate SEM.

Similar articles

Cited by

References

    1. Abad MF, Di Benedetto G, Magalhães PJ, Filippin L, Pozzan T. Mitochondrial pH monitored by a new engineered green fluorescent protein mutant. J Biol Chem. 2004;279:11521–11529. - PubMed
    1. Aberle H, Haghighi AP, Fetter RD, McCabe BD, Magalhães TR, Goodman CS. wishful thinking encodes a BMP type II receptor that regulates synaptic growth in Drosophila. Neuron. 2002;33:545–558. - PubMed
    1. Alonso MT, Villalobos C, Chamero P, Alvarez J, García-Sancho J. Calcium microdomains in mitochondria and nucleus. Cell Calcium. 2006;40:513–525. - PubMed
    1. Atwood HL, Govind CK, Wu CF. Differential ultrastructure of synaptic terminals on ventral longitudinal abdominal muscles in Drosophila larvae. J Neurobiol. 1993;24:1008–1024. - PubMed
    1. Balaban RS. Domestication of the cardiac mitochondrion for energy conversion. J Mol Cell Cardiol. 2009;46:832–841. - PMC - PubMed

Publication types

LinkOut - more resources