. 2010 Feb 3;30(5):1925-36.
doi: 10.1523/JNEUROSCI.3635-09.2010.

The effect of spatially inhomogeneous extracellular electric fields on neurons

Affiliations

The effect of spatially inhomogeneous extracellular electric fields on neurons

Costas A Anastassiou et al. J Neurosci. .

Abstract

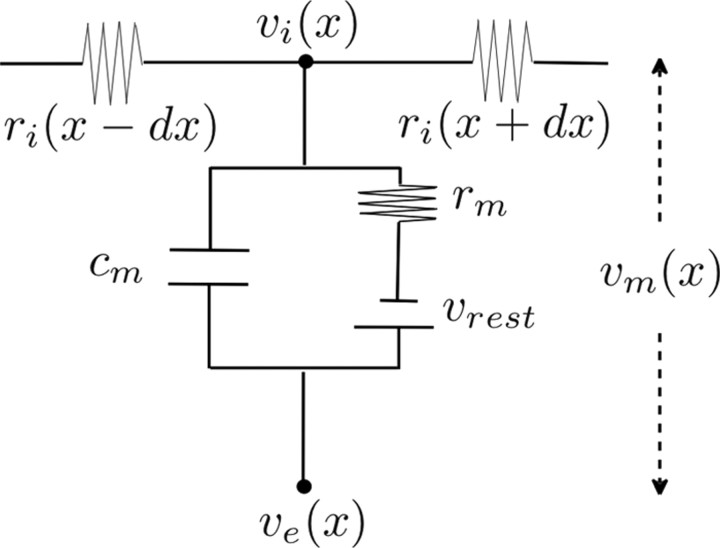
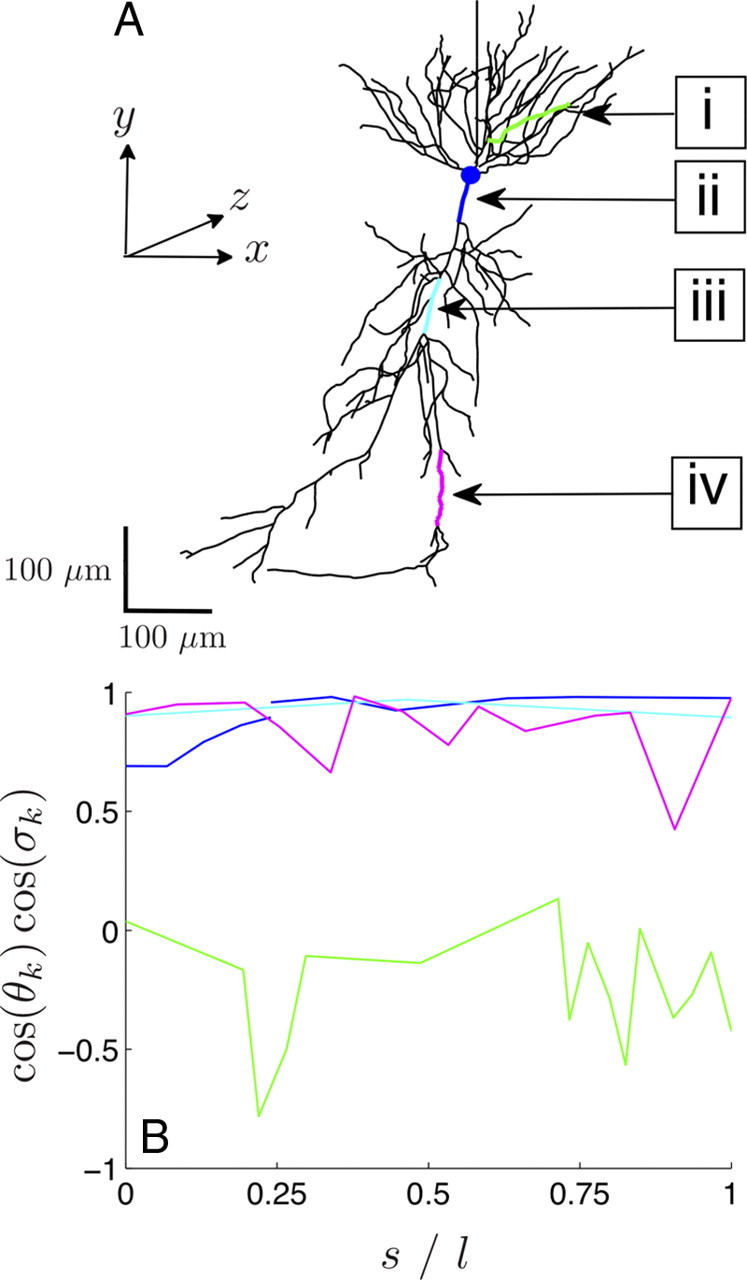
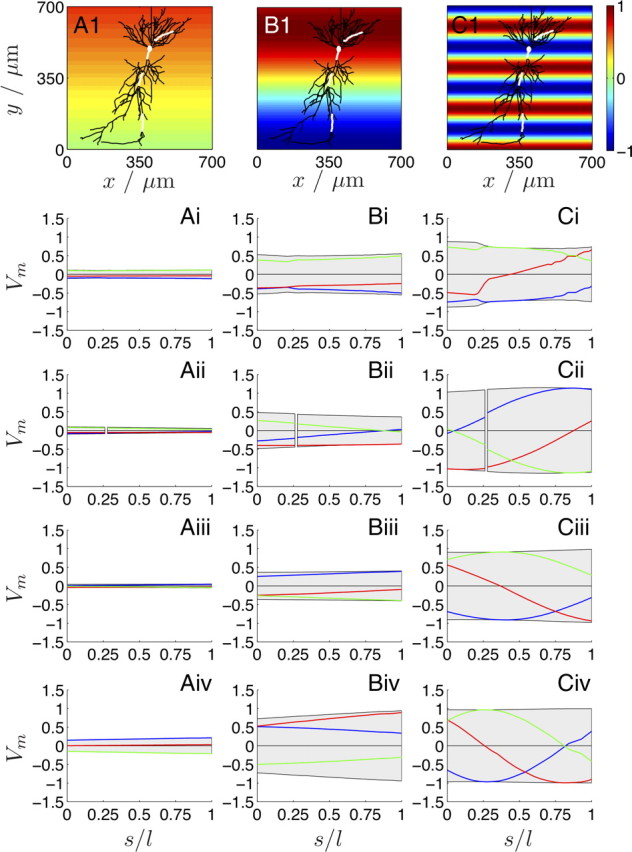
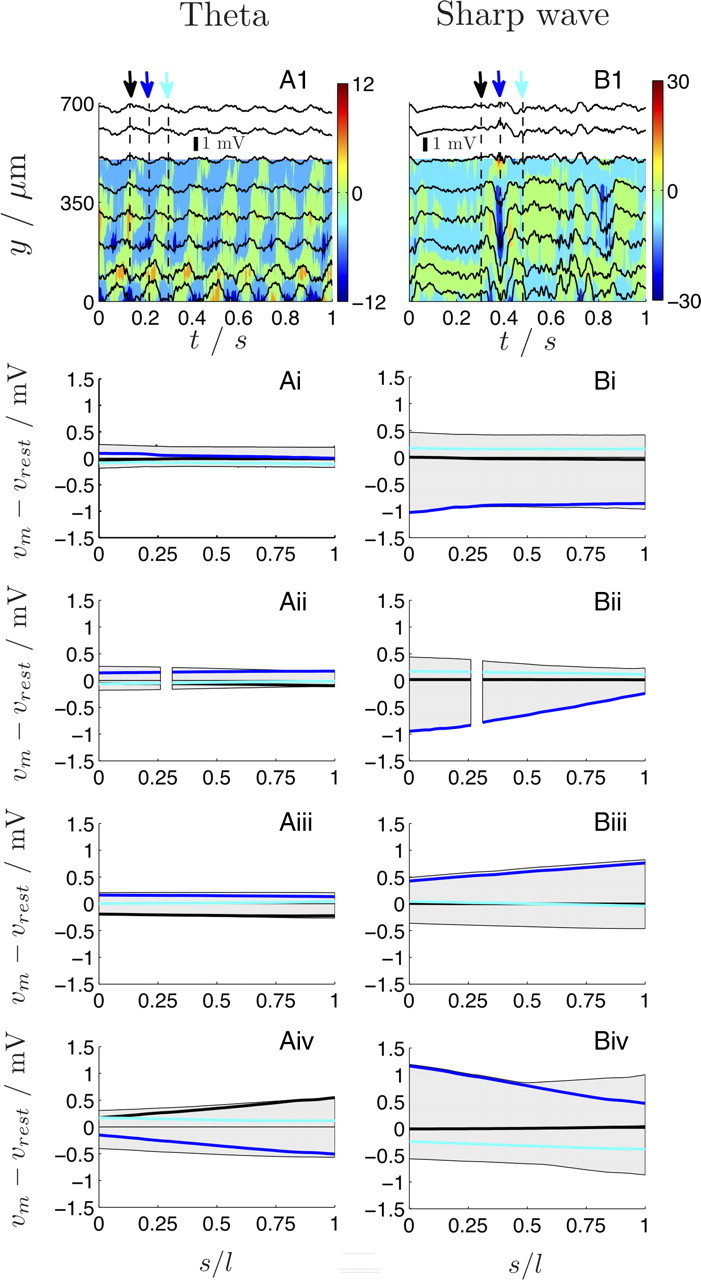
The cooperative action of neurons and glia generates electrical fields, but their effect on individual neurons via ephaptic interactions is mostly unknown. Here, we analyze the impact of spatially inhomogeneous electric fields on the membrane potential, the induced membrane field, and the induced current source density of one-dimensional cables as well as morphologically realistic neurons and discuss how the features of the extracellular field affect these quantities. We show through simulations that endogenous fields, associated with hippocampal theta and sharp waves, can greatly affect spike timing. These findings imply that local electric fields, generated by the cooperative action of brain cells, can influence the timing of neural activity.


Figures

Figure 1.
Figure 1.
Circuit representation of the passive membrane at location x along the cable (Rall, 1962). We here analyze the effect of spatiotemporal variations in the extracellular voltage, Ve, on the membrane voltage, vm, in terms of the normalized membrane potential, Vm (vm normalized by the amplitude of ve).
Figure 2.
Figure 2.
The effect of stationary and spatially varying extracellular voltage, Ve, along a passive cable on the normalized membrane potential, Vm, the membrane field, Em, and the membrane current source density, CSDm. Distance along the cable is normalized to unity. In the top row (A1, B1, C1), the Ve oscillation with spatial frequency Ω is shown for ΩL/2π = 0.1 (A1), 0.5 (B1), and 3 (C1), whereas the colored lines indicate ϕs = 0° (blue), 90° (green), and 180° (red). In the second row (A2, B2, C2), the induced membrane potential (Eq. 5) is plotted for these three cases. Only spatially inhomogeneous fields with a characteristic field length comparable with or smaller than the cable length result in strong Vm deviations. In the third (A3, B3, C3) and the fourth (A4, B4, C4) rows, the induced Em (Eq. 6) and CSDm (Eq. 7) are shown. The gray area designates the range for all spatial phases, whereas the dashed lines in the two bottom rows indicate the range of dimensionless extracellular field Ee and current source density CSDe, respectively. For ϕs∈[0°, 360°), the induced |Em|/Ω- and |CSDm|/Ω2-range is unity. As observed, the CSDm is analogous to the Ve profile (compare the individual Ve and CSDm profiles in the top and bottom rows) for large Ω. Note that in this, and in all remaining figures, no direct current injection or synaptic input is modeled. All changes in Vm are attributable to the spatially varying extracellular field.
Figure 3.
Figure 3.
A parent cable bifurcates into two daughter cables (all branches are in the same plane) in the presence of a spatially inhomogeneous extracellular voltage. The external potential Ve that varies over a half-cycle is indicated in color. The cable impedances are matched by applying the 3/2 rule (Rall, 1962). The parent cable is aligned to the external field axis, whereas the angle between the daughter cables and the field axis are as follows: θd,1 = 0° and θd,2 = −45° (A), θd,1 = 45° and θd,2 = −45° (B), and θd,1 = 90° and θd,2 = −45° (C). Below each case, the resulting Vm (second row), Em (third row), and CSDm (fourth row) are shown for ϕs = 0° (blue), 90° (green), and 180° (red). Note that for X > 0.5L, the dashed colored lines illustrate the trajectory of vm along the dashed daughter branch (see first row of the figure) for the three ϕs, whereas the solid colored lines show the trajectory of vm along the solid daughter branch. The daughter branches are of equal normalized length as the parent branch, Lparent = Ldaughter = L/2. The range of Vm, Em, and CSDm along all branches is indicated by the gray areas. Note the increasing attenuation in the induced Em- and CSDm-range as the daughter cable becomes perpendicular to the external field axis.
Figure 4.
Figure 4.
Morphology of a reconstructed rat CA1 pyramidal neuron. A, The designated sections are a basal dendrite (green) (i), the soma and the proximal apical dendrite connected to it (blue) (ii), a medial apical dendrite (cyan) (iii), and a distal apical dendrite (magenta) (iv). B, The orientation cos(θk)cos(σk) with respect to the somatodendritic axis (Fig. 4A, y-axis) is shown along each section (i–iv) as a function of the normalized arc length s/l: for the basal section (green), the soma and the proximal apical section (blue; from s/l = 0 to 0.25 soma and then proximal apical dendrite), the medial apical section (cyan), and the distal apical section (magenta). As observed, the basal dendrite is almost perpendicular to the somatodendritic axis, whereas the other three sections are relatively well aligned. The length l of each section is provided in Table 1.
Figure 5.
Figure 5.
The effect of a spatially harmonic one-dimensional electric field (along the somatodendritic axis) on the Vm of the reconstructed CA1 neuron (top row; white lines indicate the same four sections as in Fig. 4A) for three spatial frequencies: λs = 6.25 mm (fs = 0.16 mm−1; A), 1 mm (1 mm−1; B), and 0.2 mm (5 mm−1; C). The color map illustrates the (spatially) one-dimensional extracellular Ve oscillation along the somatodendritic axis for a phase ϕy. The distance along each section is shown as dimensionless arc length s/l. i is the basal; ii, the soma and the proximal apical; iii, the medial apical; and iv, the distal apical section (Fig. 4A, Table 1). The range of Vm is indicated in gray, whereas the individual traces are ϕy = 0° (blue), 45° (red), and 90° (green). Condition (II) is only satisfied for λs = 0.2 mm (5 mm−1; C) along the proximal (Cii), medial (Ciii), and distal apical (Civ) sections (Table 1) as observed from the induced Vm range.
Figure 6.
Figure 6.
A, The maximum and minimum of the normalized membrane potential Vm in the presence of a spatially inhomogeneous and oscillating extracellular field Ve. The colored areas indicate the Vm amplitude along the cable for dc (gray area), and ft = 100 (green area) and 200 Hz (red area). As expected for a low-pass membrane, for increasing values of the temporal frequency ft (arrows), Vm follows less and less the Ve oscillation. B, The effect of the time-dependent harmonic excitation on Vm as described through the normalized deviation β(Vm). As long as β(Vm) ≈ 0, the membrane response remains quasistationary. Once β deviates from zero, low-pass filtering affects the overall process. The results are shown for the basal dendrite (crosses), the soma (circles), the proximal apical dendrite (squares), the medial apical dendrite (diamonds), and the distal apical dendrite (x) in black color. The excitation was spatially centered at the middle of each section. For a typical value of τm = 20 ms, (2π ft τm)1/2 = 1 and 5 are equivalent to ft ≈ 8 and 200 Hz, respectively. β(Vm) is also shown for the unbranched cable case (red line) for comparison.
Figure 7.
Figure 7.
The effect of theta (left column) and SPW (right column) extracellular field activity on the membrane potential vm of a CA1 pyramidal neuron. A1, B1, The individual extracellular recordings (black traces) from equally spaced recording sites (8 of the 16 electrodes are shown) (supplemental Figs. S6, S7, available at www.jneurosci.org as supplemental material) are shown during two 1 s epochs, starting from the stratum lacunosum moleculare (y = 0 μm) toward the stratum oriens (y = 700 μm). The color map shows the current source density csde (units, millivolts per square millimeter) (Mitzdorf, 1985). Based on experimental evidence suggesting that the endogenous field is strongest along the somatodendritic axis of CA1 neurons, we applied the ve recordings (A1, B1) along the y-axis of the realistic neuron (Fig. 4A) and calculated the resulting spatiotemporal evolution of vm (supplemental section 7, available at www.jneurosci.org as supplemental material). Ai–Aiv, LFP-induced deviations of vm along each section (i–iv) (Table 1) during theta. The gray areas indicate the range, whereas the three individual traces show vmvrest along each section for t = 0.13 s (black), 0.22 s (blue), and 0.30 (cyan) and are indicated by the arrows in the top row. The periodic fluctuations of the extracellular potential induces a location-specific fluctuation of the membrane potential that increases in amplitude toward stratum lacunosum moleculare. The antiphase relationship between the somatic and apical dendritic ve fluctuations results in an antiphase vm fluctuation; that is, compare vm at the theta peak (black arrow and lines) and at the trough of theta (blue arrow and lines) at the soma (Aii) and the distal apical section (Aiv), respectively. Bi–Biv, LFP-induced changes in vm during the SPW. The three individual traces show vmvrest along each section for t = 0.30 s (black), 0.38 s (blue), and 0.48 (cyan). Note the pronounced antiphase relationship in vm at the SPW negativity (blue arrow and lines) between the soma (Bii) and the medial apical section (Biii). Unlike theta, the somatic membrane potential is significantly, but transiently, entrained during the SPW: compare vm deviations immediately before (black arrow and lines) and after (cyan arrow and lines) the SPW (supplemental movies, available at www.jneurosci.org as supplemental material).

Similar articles

Cited by

References

    1. Bédard C, Kröger H, Destexhe A. Modeling extracellular field potentials and the frequency-filtering properties of extracellular space. Biophys J. 2004;86:1829–1842. - PMC - PubMed
    1. Bernander O, Douglas RJ, Martin KA, Koch C. Synaptic background activity influences spatiotemporal integration in single pyramidal cells. Proc Natl Acad Sci U S A. 1991;88:11569–11573. - PMC - PubMed
    1. Bikson M, Inoue M, Akiyama H, Deans JK, Fox JE, Miyakawa H, Jefferys JGR. Effects of uniform extracellular DC electric fields on excitability in rat hippocampal slices in vitro. J Physiol. 2004;557:175–190. - PMC - PubMed
    1. Bragin A, Jandó G, Nádasdy Z, Hetke J, Wise K, Buzsáki G. Gamma frequency (40–100 Hz) patterns in the hippocampus of the behaving rat. J Neurosci. 1995;15:47–60. - PMC - PubMed
    1. Bullock TH, Buzsáki G, McClune MC. Coherence of compound field potentials reveals discontinuities in the CA1-subiculum of the hippocampus in freely-moving rats. Neuroscience. 1990;38:609–619. - PubMed

Publication types

MeSH terms