. 2010 Feb 3;30(5):1947-67.
doi: 10.1523/JNEUROSCI.3762-09.2010.

Vibrissa-based object localization in head-fixed mice

Affiliations

Vibrissa-based object localization in head-fixed mice

Daniel H O'Connor et al. J Neurosci. .

Abstract

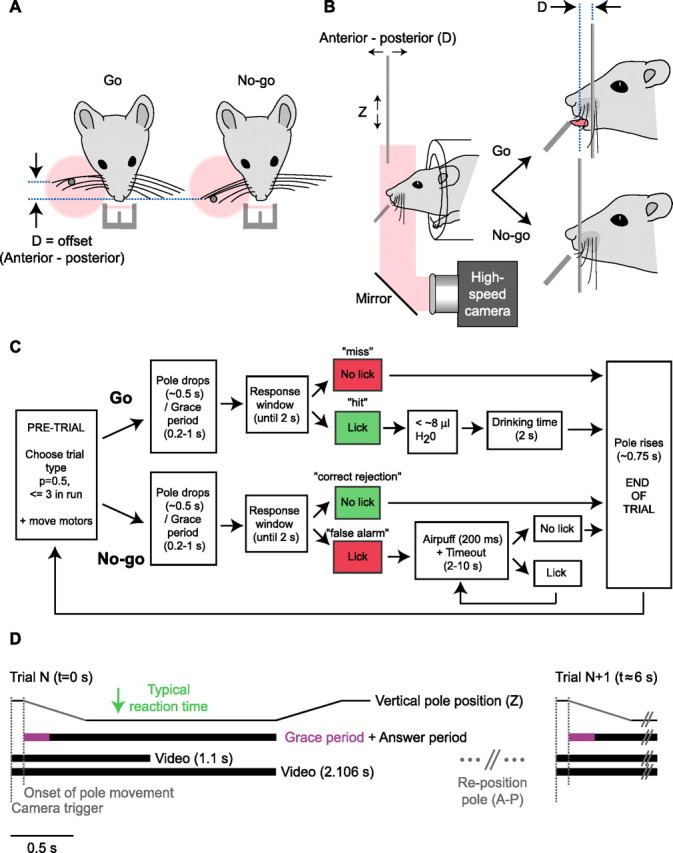
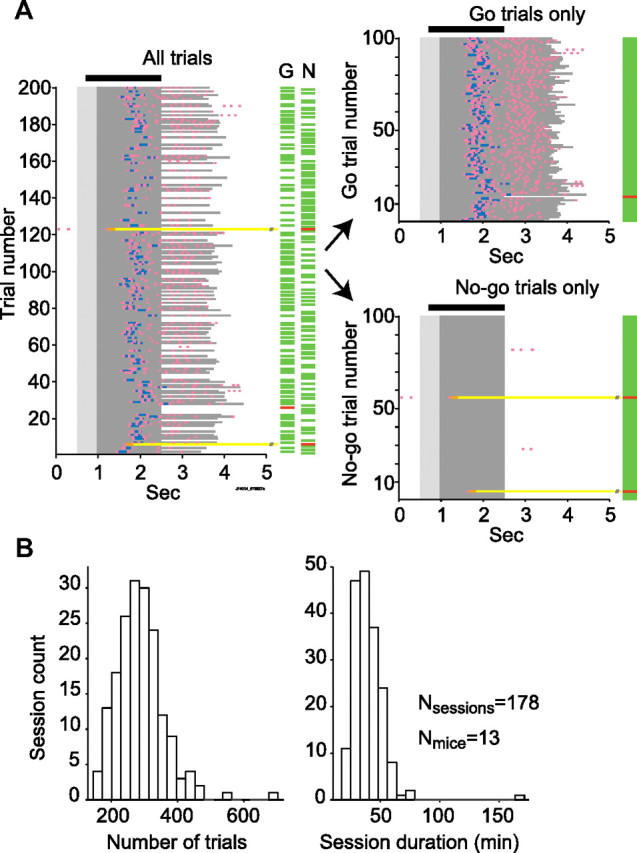
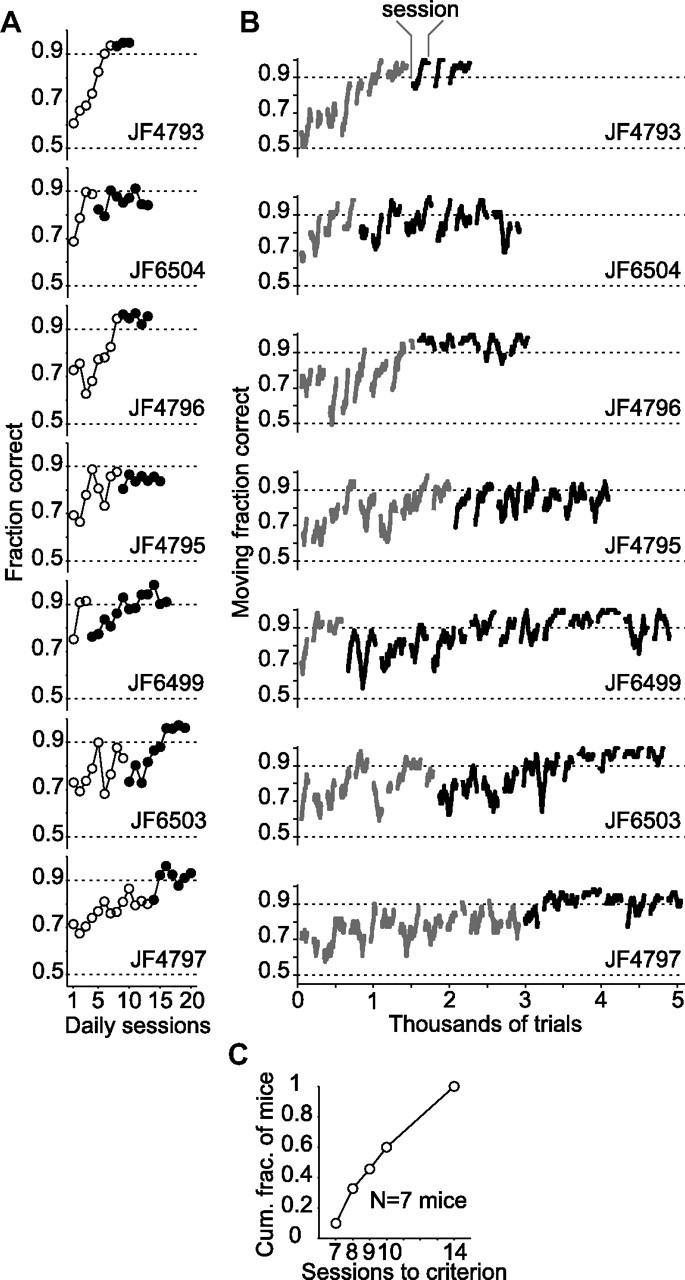
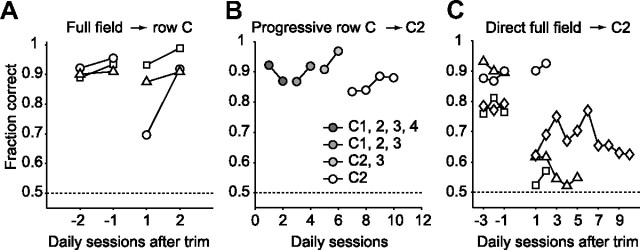
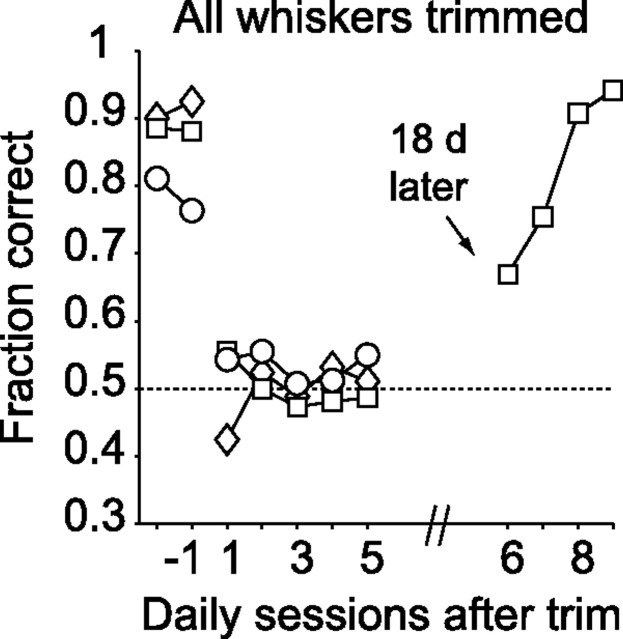
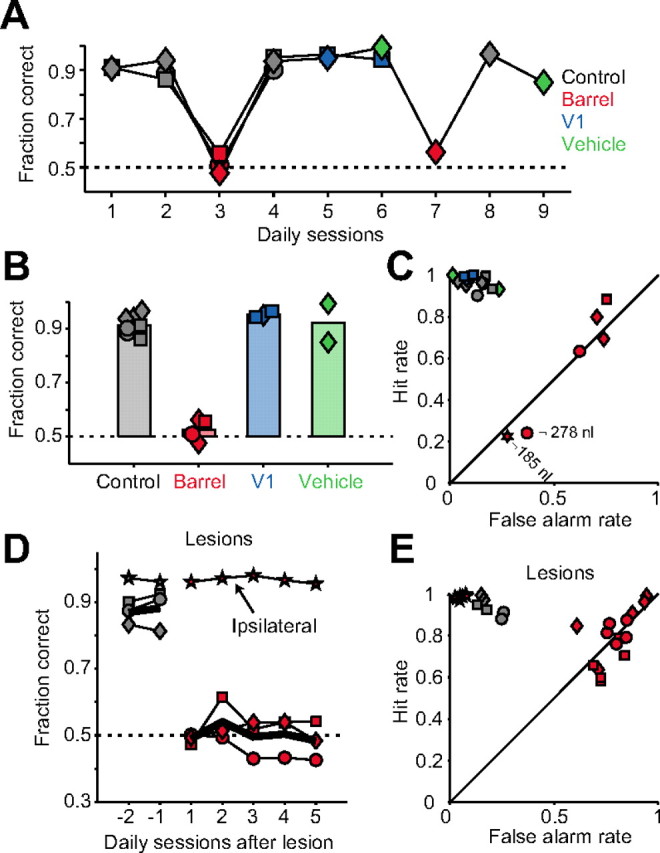
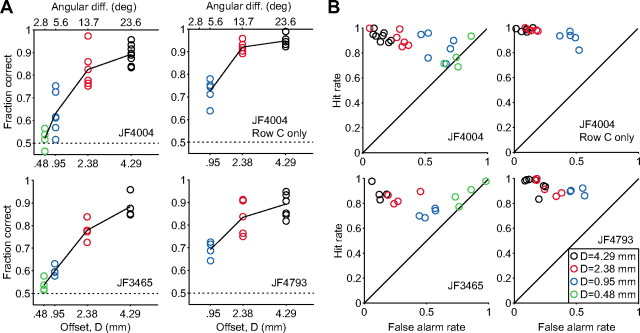
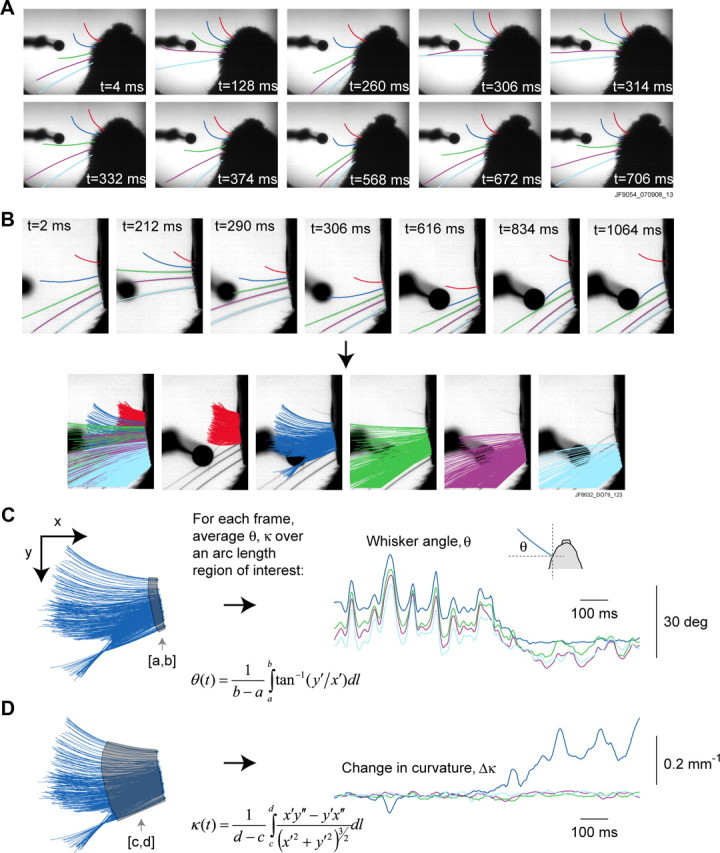
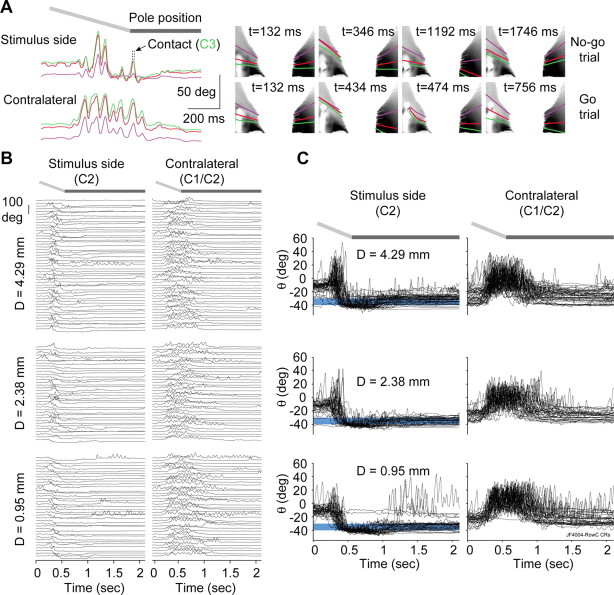
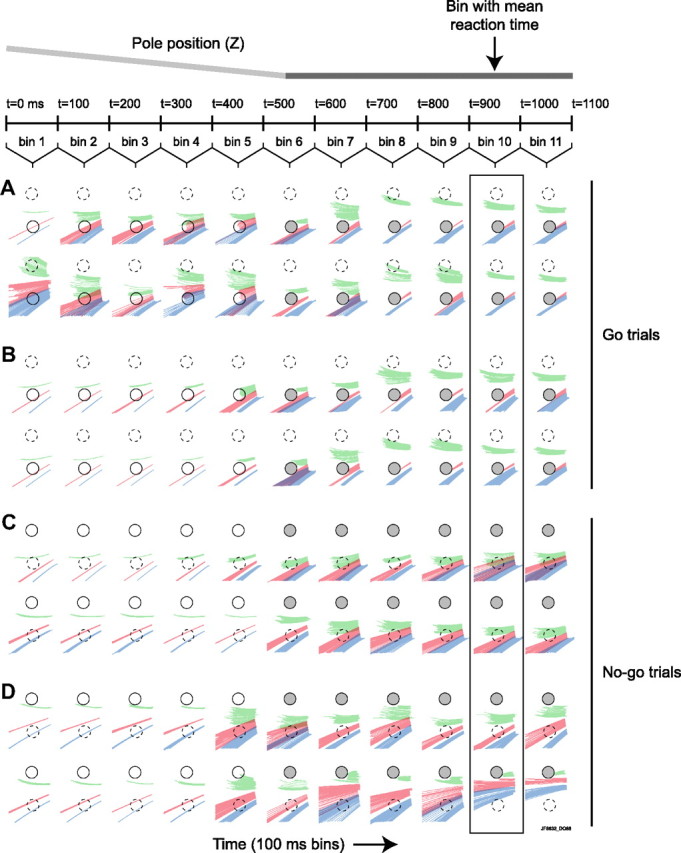
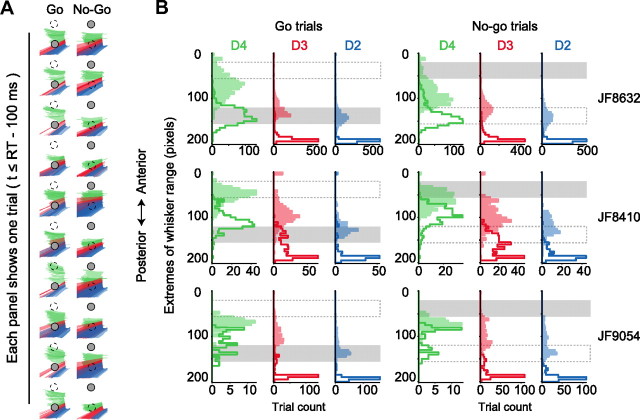
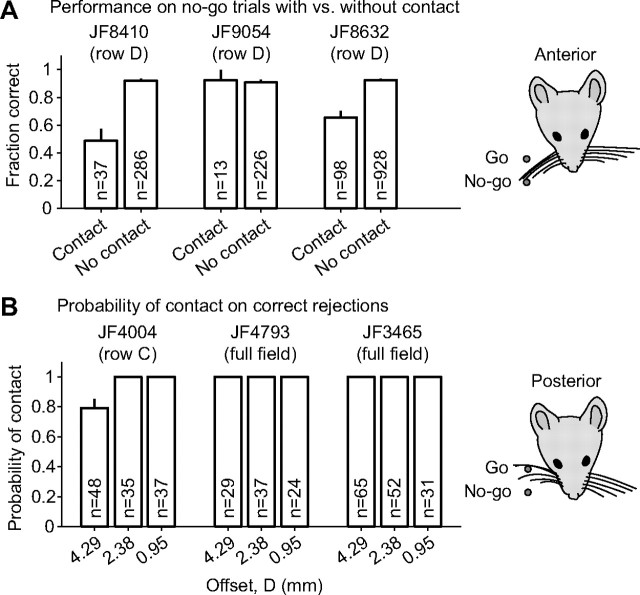
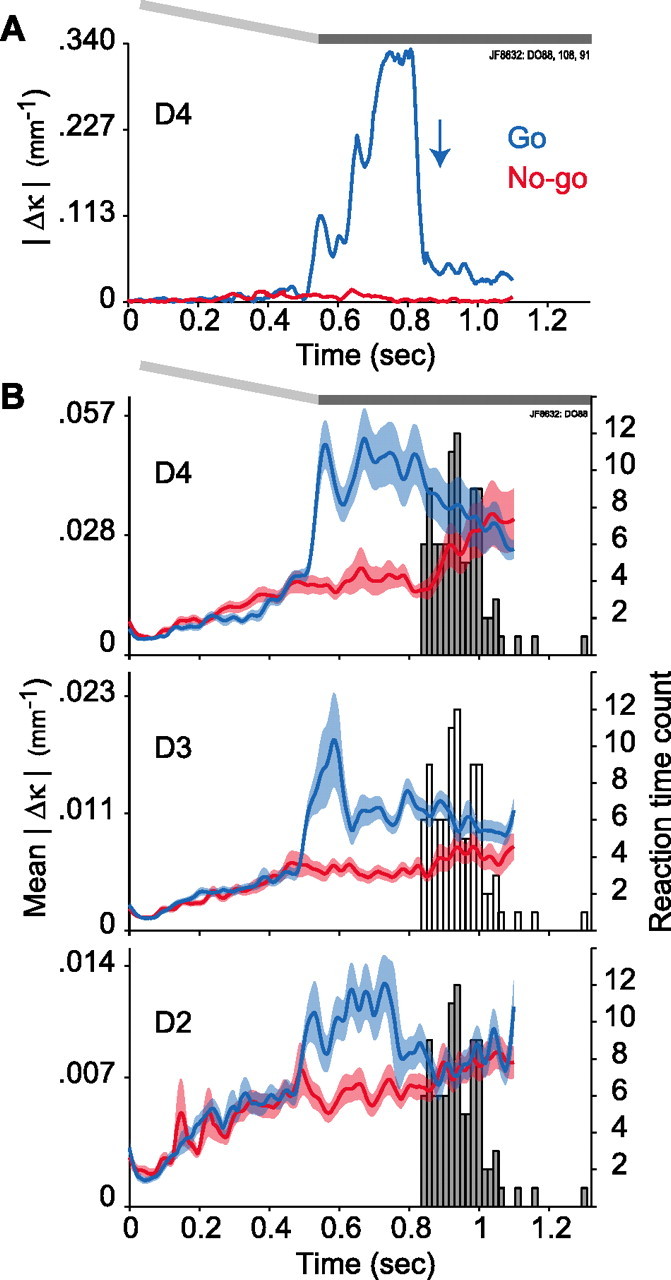
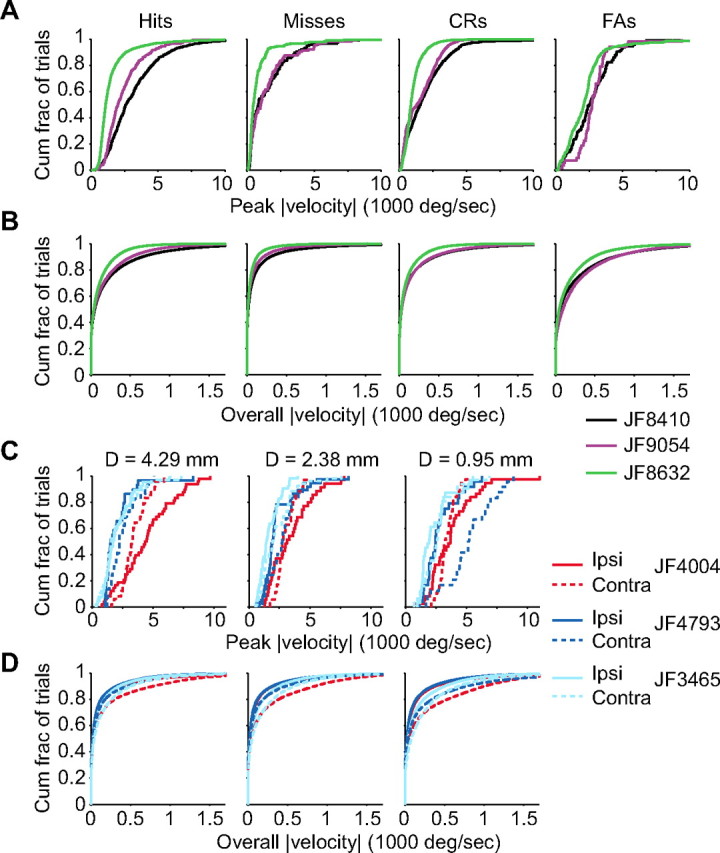
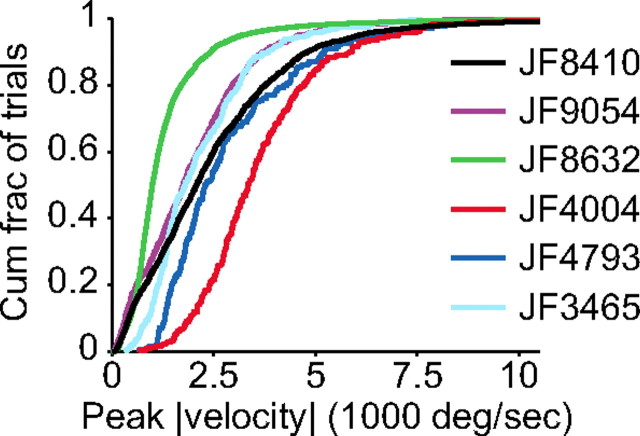
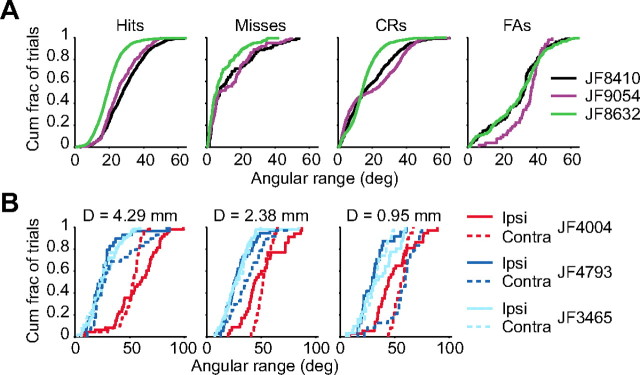
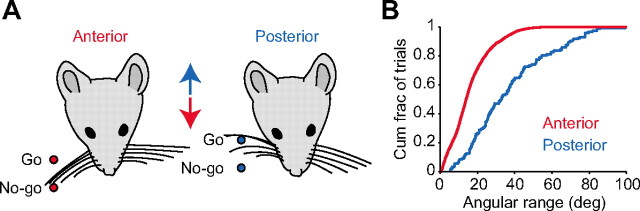
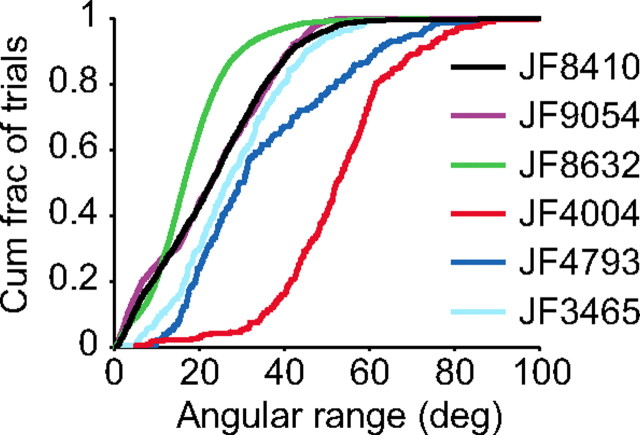
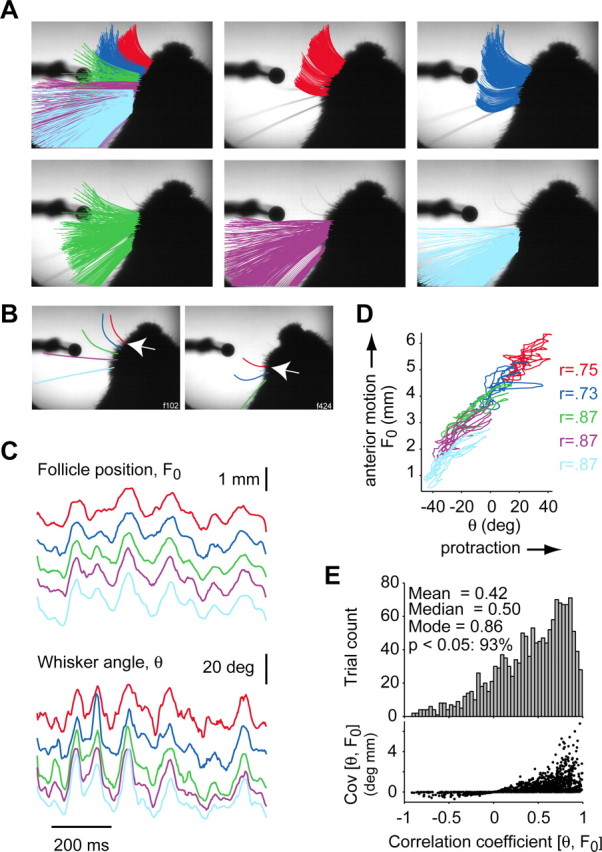
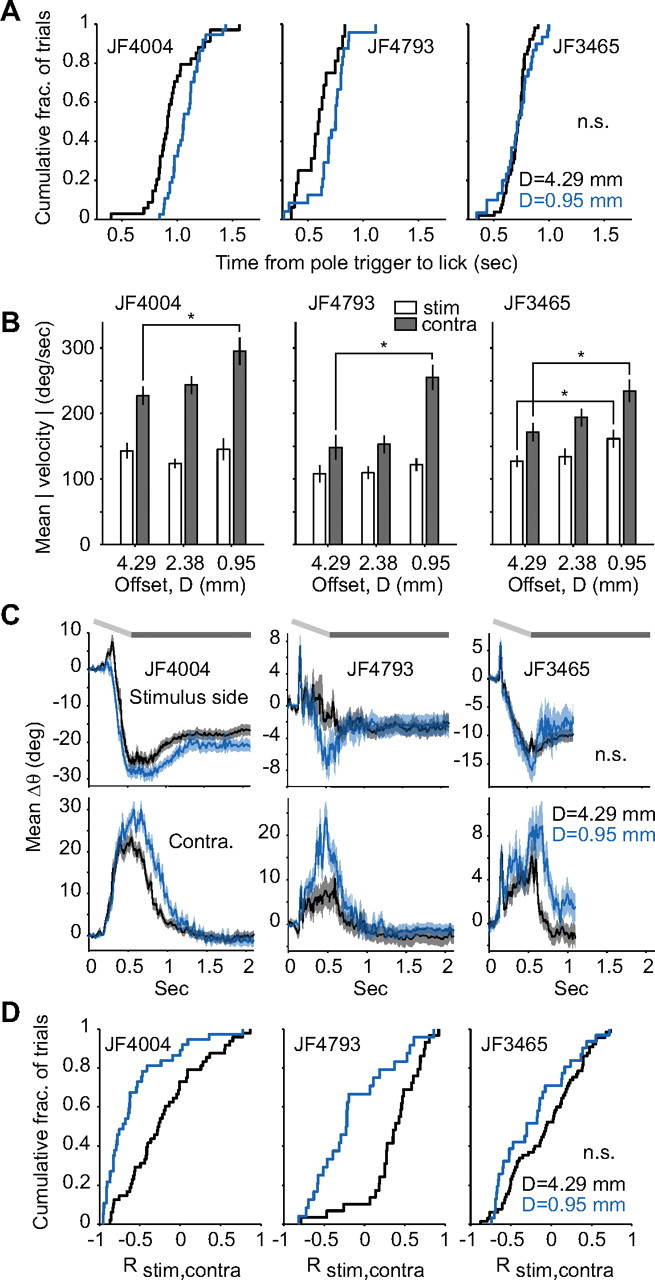
Linking activity in specific cell types with perception, cognition, and action, requires quantitative behavioral experiments in genetic model systems such as the mouse. In head-fixed primates, the combination of precise stimulus control, monitoring of motor output, and physiological recordings over large numbers of trials are the foundation on which many conceptually rich and quantitative studies have been built. Choice-based, quantitative behavioral paradigms for head-fixed mice have not been described previously. Here, we report a somatosensory absolute object localization task for head-fixed mice. Mice actively used their mystacial vibrissae (whiskers) to sense the location of a vertical pole presented to one side of the head and reported with licking whether the pole was in a target (go) or a distracter (no-go) location. Mice performed hundreds of trials with high performance (>90% correct) and localized to <0.95 mm (<6 degrees of azimuthal angle). Learning occurred over 1-2 weeks and was observed both within and across sessions. Mice could perform object localization with single whiskers. Silencing barrel cortex abolished performance to chance levels. We measured whisker movement and shape for thousands of trials. Mice moved their whiskers in a highly directed, asymmetric manner, focusing on the target location. Translation of the base of the whiskers along the face contributed substantially to whisker movements. Mice tended to maximize contact with the go (rewarded) stimulus while minimizing contact with the no-go stimulus. We conjecture that this may amplify differences in evoked neural activity between trial types.


Figures

Figure 1.
Figure 1.
A go/no-go tactile object localization task for head-fixed mice. A, Top-view schematic of position of the go (left) and no-go (right) stimuli. A thin pole was presented lateral to the mouse face on one side. The go and no-go positions differed along the anterior–posterior axis. A lickport comprising a water spout for reward delivery and an LED/phototransistor pair for recording lick responses was placed in front of the mouse. The area surrounding the pole and the whiskers was illuminated for high-speed videography with 940 nm infrared light (shown in pale red). B, Side-view schematic showing stimulus geometry. The pole moved in the anterior–posterior axis and also up and down, into and out of reach of the whiskers. Go and no-go trials differed in the anterior–posterior position of the pole. On go trials, mice licked at the lickport; on no-go trials, mice had to withhold licks. The mouse crouched in a natural position inside a tube, with its head in a fixed position in front of the tube (head fixation not shown). The pale red shading indicates high-speed video illumination as in A. C, Block diagram of the sequence of events for a single trial (see Materials and Methods). D, Schematic timeline of events during a trial. The trial begins with the triggering of either a 1.1 or a 2.106 s high-speed video sequence. Shortly afterward, the pole began its descent into reach of the whiskers. During a short grace period, indicated in purple, any lick responses from the mouse were not used to score the trial (typically, trained mice did not lick during this grace period anyway). The period of time during which the pole is moving into position is indicated by gray shading.
Figure 2.
Figure 2.
Mice perform at high levels for hundreds of trials. A, Raster of events from 200 trials from an example behavioral session. The abscissa shows time from start of trial. The pink tick marks indicate licks (photobeam interruptions). Go and no-go trials are randomly interleaved in the order performed by the mouse (left side) or separated into go and no-go trials (right). The horizontal green and red marks in right columns indicate whether each trial is correct or incorrect, respectively, and on the left raster are separated into two columns corresponding to go (labeled “G”) and no-go (labeled “N”) trials. The light gray shading shows approximate travel time of the pole as it descends. The dark gray shading indicates that the pole is fully descended and in reach of the whiskers. The blue bars indicate open times of the reward water valve. The orange bars indicate open time of the air puff valve. The yellow bars show the time-out period and are truncated on the right side for clarity (otherwise extending past 5 s). The horizontal black bar at the top of each raster indicates the answer period window (see Materials and Methods). In this session, the mouse performed easy localizations of stimuli separated by 4.29 mm. In simple localizations, trained mice make few licks outside of the appropriate times. B, Histograms of number of trials completed per session (left) and session duration (right) for trained mice.
Figure 3.
Figure 3.
Learning is rapid and occurs both across and within sessions. A, Learning curves for a cohort of seven mice. Each data point shows performance averaged over a session. The hollow data points indicate the first stage of training in which go and no-go stimuli were separated by 8.57 mm (see Materials and Methods). The solid points indicate an easy version of the final task in which stimuli are separated by 4.29 mm. The dashed lines indicate 90 and 50% correct performance. Before the first data point, mice had one to two sessions (∼10–15 min each) of learning to lick at the lickport. B, Moving average performance (window of 61 trials) from the same mice and sessions shown in A. In several cases, performance increases during the course of an individual session. The gray curves show 8.57 mm offset sessions and correspond to hollow symbols in A. The black curves correspond to the filled symbols in A. The dashed lines indicate 90 and 50% correct performance. Individual sessions correspond to single unbroken curves, separated by small gaps. Gaps reflect the few trials from the beginning of each session that were not analyzed (see Materials and Methods) and 30 trials at the start and end of each session that reflect moving average start-up/ending transients and are not plotted. C, Cumulative histogram of the number of daily localization sessions to an 85% correct performance criterion across mice. The fastest mouse achieved criterion performance in 7 sessions, and the slowest in 14 sessions.
Figure 4.
Figure 4.
A single whisker is sufficient for object localization. A, Performance of mice recovers quickly after trimming from a full whisker field down to row C only. The plot symbols show session-averaged performance for three different mice. Two consecutive sessions before whisker trimming (x-axis ticks at −2, −1), and two consecutive sessions after are shown. By the second session after trimming, performance has recovered to baseline levels. B, Performance for one mouse as whiskers are trimmed progressively from row C to C2. Even with a single whisker, the mouse performs at a high level. C, Performance of mice after abrupt trimming from a full whisker field to C2. The plot symbols show four different mice for three sessions before trimming (x-axis ticks from −3 to −1) and up to 10 sessions after trimming. Mice perform above chance but most (3 of 4) show a significant decline in performance. Furthermore, three of four mice eventually lost C2. Abrupt trimming from the full whisker field to a single whisker did not therefore result in stable, high performance.
Figure 5.
Figure 5.
Whiskers are necessary for object localization. After abrupt trimming of all whiskers, performance declines to chance levels. Different plot symbols show three mice for two sessions before (x-axis ticks at −2, −1) and five sessions after all whiskers were cut short enough that they did not contact the pole. Chance performance is indicated by the dashed line. Even after five sessions, mice did not use any nonwhisker cues, indicating that our task is whisker dependent. After 18 d of whisker regrowth, one mouse was tested again; by the third session, performance had reached pretrimming levels.
Figure 6.
Figure 6.
Contralateral somatosensory cortex is necessary for object localization. A, Time series showing performance across several consecutive daily sessions in which muscimol was injected or control experiments were performed. The plot symbol shapes indicate three different mice. The gray fill color indicates control sessions with no injections. The red fill indicates muscimol injections into barrel cortex (70 nl; 5 μg/μl). The blue fill indicates injections of muscimol (70 nl; 5 μg/μl) into primary visual cortex (V1). The green fill indicates injections of saline vehicle (with no muscimol) into barrel cortex. After one to two sessions of control experiments, muscimol was injected into barrel cortex (see Materials and Methods) and performance decreased to chance levels. The following day, performance recovered to baseline levels. Control injections of either saline vehicle into barrel cortex or muscimol into primary visual cortex produced no change in performance. B, Bar graph showing the same data as in A, but collapsed across time. The plot symbol shapes again indicate different mice. C, Hit rate plotted against false alarm rate shows that performance decrements after muscimol injection into barrel cortex result from both an increase in false alarm rate and a decrease in hit rate. The diagonal indicates chance performance. Two additional plot symbols marked “185 nl” and “278 nl” indicate that larger volumes of 5 μg/μl muscimol depress overall lick rate; these data are not included in A and B. The plot symbol shapes and fill colors are as in A and B. D, Performance drops to chance levels in mice after aspiration lesions to somatosensory cortex contralateral to the pole stimulus. The plot symbols show different mice. The plot shows two sessions before lesioning (x-axis ticks at −2, −1; gray fill color) and five sessions after lesioning (red fill), during which performance does not recover. In one mouse (indicated by the star plot symbols and the arrow), the lesion was made on the stimulus (ipsilateral) side and produced no deficit. The thick black lines indicate average performance across mice with contralateral cortex lesions. E, Plotting hit rate against false alarm rate for the data in D shows that performance deficits were attributable to changes in both hit rate and false alarm rate, but mainly to the latter. The plot symbol shapes and fill colors are as in D.
Figure 7.
Figure 7.
Mice make absolute (memory-guided) azimuthal localizations to better than 6°. A, Psychometric curves for three mice relating offset between go and no-go stimulus positions to performance. For one mouse (JF4004), curves were taken separately with all whiskers and with row C whiskers only. The pole stimulus was moved along the anterior–posterior axis. Approximate azimuthal angular differences corresponding to each offset are shown on the top abscissa. Each data point shows the average performance over a session. Curves connect the means for each offset. The colors indicate different offsets and are the same as in B. All mice are above chance at the 0.95 mm (5.6°) offset. One mouse (JF3465) performs above chance level at the 0.48 mm (2.8°) offset, although this is marginally significant (p = 0.0625). B, Plots of hit rate against false alarm rate show that decreases in performance at smaller offsets were attributable both to a decrease in hit rate and an increase in false alarm rate, but mainly to the latter. The diagonal indicates chance performance.
Figure 8.
Figure 8.
Extracting azimuthal angle and curvature from high-speed video of whiskers. A, Tracking whiskers in head-fixed mice. Images show a bottom view of the pole stimulus and the mouse. The mouse has a single row of whiskers that were tracked with custom software (see Materials and Methods). The lickport has been moved away and the field-of-view expanded to show the geometry of the pole, mouse head, and whiskers. B, Video showing the lickport in place and zoomed to the field-of-view used for the majority of videos (different mouse and session from A). Single video frames (top row) show the pole descending, as well as changes in the position of the whiskers and curvature change in one whisker (blue) that contacts the pole. The bottom row depicts projections through all video frames. Whiskers are plotted together (left image) or individually (right five images), superimposed on an arbitrary frame from the video. C, Azimuthal angle (θ) was computed over a small arc length region of interest near the whisker base for each frame (see Materials and Methods). Choice of the region of interest is illustrated schematically for a single whisker (D4; blue) at left. Angle for several whiskers is shown as a function of time for a single trial at right. D, Signed curvature (κ) was computed over an arc length region of interest for each frame for a given whisker (see Materials and Methods). The region of interest for measuring curvature was longer than that used for measuring angle. Choice of region of interest is illustrated at left. At right, change in curvature (Δκ) as a function of time is shown for several whiskers. Δκ was computed as curvature minus the mean curvature in the first 100 ms of the trial. Each Δκ trace has been smoothed with a 50 ms second-order Savitsky–Golay filter. Data in B–D are all from the same trial.
Figure 9.
Figure 9.
Whisking can be highly asymmetric and is directed to the region of the rewarded (go) stimulus. A, Example whisker angle traces for three tracked whiskers from one trial on the stimulus side of the mouse (left, top traces) and on the contralateral side (left, bottom traces). The light gray slanted bar at top indicates approximate travel time of the pole on its descent. The dark gray horizontal bar indicates that the pole is in its bottom position, within reach of the whiskers. A moment of contact between whisker C3 and the pole is indicated by the arrow (top traces). Whisking is highly asymmetric between the stimulus and contralateral sides. Movie frames at right highlight asymmetric search strategy of the mouse on a no-go trial (right, top row of frames; same trial shown in traces at left) and a go trial (right, bottom row of frames). In both the no-go and the go trials, the mouse retracts its whiskers on one side to search the position where the rewarded (go) stimulus occurs, whereas the contralateral whiskers make unrelated protractions and retractions. B, Rasters of whisker angle traces for the stimulus side (left column) and contralateral side (right column) whiskers for one mouse across many no-go trials and three levels of difficulty (go/no-go position offsets of D = 4.29, 2.38, and 0.95 mm, separated by vertical gaps). Horizontally aligned pairs of traces in the stimulus and contralateral rasters correspond to the same trial. Trials were acquired across several behavioral sessions. The order of trials in the raster was randomized within the three difficulty groups. For the stimulus side, all traces show the position of whisker C2. In some trials on the contralateral side, whisker C1 was traced instead of C2 because C2 protracted far enough that it left the field of view. Slanted and horizontal gray bars at top indicate pole travel time and position, as described for A. Whisking on the stimulus and contralateral sides is highly asymmetric, with more cycles of protraction and retraction on the contralateral side. C, Data from B at higher zoom, with traces from different trials plotted on top of each other to reveal whisking strategy. On the stimulus side, after a brief protraction the whiskers retract and selectively explore the region of the go stimulus (whose approximate angular position is indicated by the blue bar underneath the whisker traces), even though all traces are from no-go trials. On the contralateral side, whiskers protract and retract for several cycles around a slightly protracted set point. The slanted and horizontal gray bars at top indicate pole travel time and position, as described for A. No-go position stimuli (data not shown) are located ∼23.6, 13.7, and 5.6° more protracted (positive) than the indicated go-position stimuli for the D = 4.29, 2.38, and 0.95 mm offsets, respectively. Data in A–C are from a single mouse (JF4004) trimmed to a single row (C) of whiskers. Traces from this mouse were the most consistently asymmetric of the three mice in which we tracked whiskers on both sides of the head. The other two mice, although less stereotyped than the mouse shown here, also showed this same basic asymmetric pattern (for average whisker position traces for two additional mice, see Fig. 20C).
Figure 10.
Figure 10.
Whisking is directed and differs between go and no-go trials. Movie-style projections of three tracked whiskers (D4, green; D3, red; D2, blue) through time in consecutive 100 ms bins, for four go trials (A, B) and four no-go trials (C, D). Each row of projections depicts a single trial. Anterior is at top. Each 100 ms bin is the projection of whiskers through 50 frames (acquired at 500 Hz) and shows the region of space explored within that 100 ms period. There are 11 bins covering the period from 0 to 1.1 s, arranged left to right. The light gray slanted bar at top indicates approximate travel time of the pole on its descent. The dark gray horizontal bar indicates that the pole is in its bottom position. Trials are from a single behavioral session. The solid black circles depict the pole location. The dashed black circles indicate the position of the pole on the other type of trial. The gray fill in the circles indicates that the pole is at the bottom of its range and within reach of the whiskers in that time bin. The vertical black box indicates the bin containing the mean reaction time. A, Example (go) trials in which the whiskers are in motion during the first couple hundred milliseconds of the trial, before the pole is in reach. B, Trials in which the whiskers start moving immediately before the pole is accessible, or around the same time that the pole is accessible. C, No-go trials in which the mouse searches the go position and avoids the no-go position, even though the pole is in the no-go position. D, No-go trials in which the mouse primarily searches the go position but also whisks forward into the no-go position. This type of trial is less common that the type shown in C. A–D, In many trials, the mouse has positioned at least one of its whiskers in the path of the go stimulus, in a position more protracted than the resting position of the whiskers. After initial contact with the pole on go trials, the mouse pressed D4 (green) against the pole for >100 ms before protracting past the pole (toward the top of each image) to make a lick response.
Figure 11.
Figure 11.
Mice predominantly explore the region of the rewarded (go) stimulus and avoid the no-go stimulus. A, Projections of three tracked whiskers (D4, green; D3, red; D2, blue) through time for 10 go trials (left column) and 10 no-go trials (right column). Each rectangular projection shows an individual trial including all frames up to 100 ms before the mean reaction time (calculated across all tracked trials for the session) and provides a view of the space explored by the mouse before its reaction time. Anterior is at top. Trials are from a single behavioral session and are in order of consecutive presentation (although sorted into go and no-go), with trial number increasing from top to bottom. The solid black circles with gray fill depict the location of the pole. The dashed black circles indicate the (not-present) position of the pole for the other category of trials. Mice move their whiskers mainly through the region of the go stimulus and avoid the no-go stimulus position. B, Histograms show the anterior (filled) and posterior (open) extremes of whisker movement relative to the go and no-go stimulus positions, for each of three whiskers (D4, green; D3, red; D2, blue) and for three mice (JF8632, top row; JF8410, middle; JF9054, bottom). Whisker movement ranges for each trial were computed using all frames up to 100 ms before the mean reaction time. Trials are separated into go (left column) and no-go (right column). The anterior–posterior extent of the go and no-go stimuli are indicated by gray horizontal bars; the stimulus actually present for the given trial type (go or no-go) is shaded, whereas the other stimulus appears in dashed outline. Anterior is toward the top of each panel. Position was measured at the lateral distance of the medial edge of the poles. Although the whiskers often moved into the no-go stimulus position on no-go trials, the more common behavior was for the whiskers to search the go position and avoid the no-go position.
Figure 12.
Figure 12.
Contact with the pole per se is not a sufficient cue for making a go response. A, Fraction of trials correct for no-go trials with (“Contact”) and without (“No contact”) at least one whisker–pole contact, for three mice (JF8410, JF9054, JF8632). Mice correctly withheld lick responses on many no-go trials in which there was whisker–pole contact. Mice had only row D whiskers. The go and no-go positions were separated by D = 4.29 mm. On incorrect trials, in which the mouse made a lick response, only contacts occurring before the reaction time were scored. The pole positions were in the anterior configuration (indicated by the schematic at right). B, Probability of at least one whisker–pole contact on correct rejection trials for three mice at each of three difficulty levels (D = 4.29, 2.38, and 0.95 mm). Even in no-go trials, there was almost always at least one whisker–pole contact. Mouse JF4004 had only row C whiskers. Mice JF4793 and JF3465 had full whisker fields. The pole positions were in the posterior configuration (indicated by the schematic at right). A, B, The number of trials (“n”) comprising each bar is indicated. Error bars show bootstrap SEM.
Figure 13.
Figure 13.
Whisker curvature changes diverge for go and no-go trials, well before the reaction time. A, Rectified change in curvature for whisker D4 for a go (blue) and a no-go (red) trial. The blue arrow indicates the reaction time for the go trial. The light gray slanted bar at top indicates approximate travel time of the pole on its descent. The dark gray horizontal bar indicates that the pole is in its bottom position. Change in curvature (Δκ) was computed as curvature minus the mean curvature in the first 100 ms of each trial. Traces were smoothed (before rectification) with a 50 ms Savitsky–Golay second-order filter. B, Average rectified Δκ for three whiskers (D4, D3, D2) across all go (blue) and no-go (red) trials for the behavioral session in A (error shading, ±SEM). The distribution of reaction times for the go trials is shown in the middle panel and duplicated in gray in the top and bottom panels. The light gray slanted and dark gray horizontal bars are as in A. Traces from each trial comprising the average were smoothed as in A. The average traces were also smoothed with a 50 ms Savitsky–Golay filter. Ngo = 95 trials; Nno-go = 82 trials.
Figure 14.
Figure 14.
Whisker movements reach high peak velocities and vary among mice. A, Peak rectified velocity histograms for three mice in each trial category: hits, misses, correct rejections (CRs), and false alarms (FAs). B, Overall rectified velocity histograms, including velocities measured from all high-speed video frames, for the same trial categories in A. C, Peak rectified velocity histograms for three mice performing localizations at three difficulty levels (D = 4.29, 2.38, and 0.95 mm), for both stimulus-side (solid lines) and contralateral-side (dashed lines) whiskers. All trials are correct rejections. D, Overall rectified velocity histograms, including velocities measured from all high-speed video frames, for the same trials shown in C. Separate groups of three mice are shown in A and B and in C and D. Anterior–posterior location of stimuli was different for these two groups of mice (see Materials and Methods and Table 1).
Figure 15.
Figure 15.
Different mice show different distributions of peak absolute velocity. Distributions of peak rectified velocity from each trial for six mice. Data are pooled across whiskers, trial types, stimulus and contralateral sides, and go/no-go position offsets.
Figure 16.
Figure 16.
Whiskers explore an angular range between 0 and 100° that depends on the trial type and the mouse. A, Maximum angular range traversed during a trial by each whisker, across all tracked whiskers for three mice. Separate histograms are shown for each trial category: hits, misses, correct rejections (CRs), and false alarms (FAs). B, Maximum angular range traversed in each trial for three mice performing localizations at three difficulty levels (D = 4.29, 2.38, and 0.95 mm), for both stimulus-side (solid lines) and contralateral-side (dashed lines) whiskers. All trials are correct rejections. Separate groups of three mice are shown in A and B. Anterior–posterior location of stimuli was different for these two groups of mice (see Materials and Methods and Table 1).
Figure 17.
Figure 17.
Maximal angular ranges explored during a trial depend on the positions of the pole stimuli. A, Schematic of the two sets of pole positions used in the experiments reported here. The two pole positions (go and no-go) took either a more anterior (red) or a more posterior (blue) value, although the offset (D) between the go and no-go pole positions was unchanged. B, Distributions of maximum angular range traversed in each trial for the more anterior (protracted) and the more posterior (retracted) sets of positions. Mice explored a larger angular range when presented with the more posterior stimulus positions. Data are all from stimulus-side whiskers on correct rejection trials at the D = 4.29 mm offset and are pooled across whiskers.
Figure 18.
Figure 18.
Different mice show different distributions of maximal angular range. Distributions of maximal angular range from each trial for six mice are shown. Data are pooled across whiskers, trial types, stimulus and contralateral sides, and go/no-go position offsets.
Figure 19.
Figure 19.
Translation of whiskers is prominent. A, Projections of whiskers tracked through time for an example video highlight translation of the whisker base along the side of the snout. Whisker projections are superimposed on an arbitrary frame from the video and are shown either for a full row of whiskers together (top left frame) or separately for each whisker. B, Pair of individual frames with tracked whiskers illustrating large translation of a whisker (indicated by the arrow). Frames are separated by 644 ms. C, Follicle position (F0, top) and whisker angle (θ, bottom) time series from the video sequence shown in A. D, Follicle position plotted against whisker angle for each of five whiskers. Correlation coefficients (r) are shown for each whisker in colored text. The data are the same as in C. E, Correlation coefficient and covariance values for angle and the follicle position along the anterior–posterior axis for whisker D3 (see Materials and Methods). N = 1414 correct rejection trials across three mice.
Figure 20.
Figure 20.
Whisking patterns and reaction times differ based on the required precision of localization but vary among mice. A, Reaction times for lick responses measured directly from high-speed video on go trials. Reaction time is measured from the beginning of the pole descent until the mouse's tongue first leaves its mouth. Mouse JF4004 had row C whiskers only. Mice JF4793 and JF3465 had full whisker fields. Two mice (JF4004 and JF4793) showed longer reaction times for the hard (D = 0.95 mm offset) localizations than for the easy (D = 4.29 mm) localizations; reaction times for a third mouse (JF3465) were not statistically different. B, Mean rectified whisker velocity, a measure of overall whisking intensity, revealed differences in whisking among localizations of different difficulty, for the contralateral whiskers in all three mice and for the stimulus-side whiskers for one mouse. In each case, increasing difficulty resulted in greater whisking intensity. For clarity, statistically significant differences are marked with asterisks only for comparisons between the D = 0.95 mm and D = 4.29 mm offsets. Error bars show bootstrap SEM. C, Average whisker movement amplitude is larger for difficult localizations, for whiskers on both the stimulus side (top row) and the contralateral side (bottom row). Mean change in whisker angle is a combined measure of amplitude and stereotypy of whisker movement. Change in whisker angle (Δθ) is computed as whisker angle minus the mean whisker angle in a 100 ms baseline period at the beginning of each trial. Error shading indicates ±SEM. D, The correlation coefficient (Rstim,contra) for whisker angle time series between a whisker on the stimulus side and a whisker on the contralateral side, computed in the first 0.5 s of the trial (see Results). Whisker movements are more negatively correlated on difficult compared with easy localizations for two of three mice. A–D, Same data set appears in part in Figure 9.

References

    1. Berg RW, Kleinfeld D. Rhythmic whisking by rat: retraction as well as protraction of the vibrissae is under active muscular control. J Neurophysiol. 2003;89:104–117. - PubMed
    1. Birdwell JA, Solomon JH, Thajchayapong M, Taylor MA, Cheely M, Towal RB, Conradt J, Hartmann MJ. Biomechanical models for radial distance determination by the rat vibrissal system. J Neurophysiol. 2007;98:2439–2455. - PubMed
    1. Boyden ES, Raymond JL. Active reversal of motor memories reveals rules governing memory encoding. Neuron. 2003;39:1031–1042. - PubMed
    1. Brecht M, Sakmann B. Dynamic representation of whisker deflection by synaptic potentials in spiny stellate and pyramidal cells in the barrels and septa of layer 4 rat somatosensory cortex. J Physiol. 2002;543:49–70. - PMC - PubMed
    1. Carvell GE, Simons DJ. Biometric analysis of vibrissal tactile discrimination in the rat. J Neurosci. 1990;10:2638–2648. - PMC - PubMed

Publication types

LinkOut - more resources