. 2010 Jun 3;115(22):4403-11.
doi: 10.1182/blood-2009-09-241083. Epub 2010 Feb 3.

The post sepsis-induced expansion and enhanced function of regulatory T cells create an environment to potentiate tumor growth

Affiliations

The post sepsis-induced expansion and enhanced function of regulatory T cells create an environment to potentiate tumor growth

Karen A Cavassani et al. Blood. .

Abstract

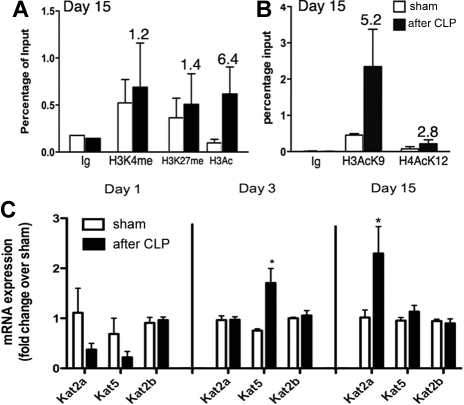
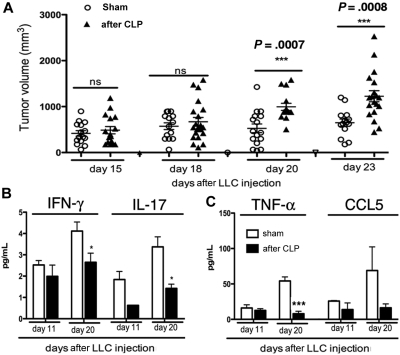
One of the more insidious outcomes of patients who survive severe sepsis is profound immunosuppression. In this study, we addressed the hypothesis that post septic immune defects were due, in part, to the presence and/or expansion of regulatory T cells (Tregs). After recovery from severe sepsis, mice exhibited significantly higher numbers of Tregs, which exerted greater in vitro suppressive activity compared with controls. The expansion of Tregs was not limited to CD25(+) cells, because Foxp3 expression was also detected in CD25(-) cells from post septic mice. This latter group exhibited a significant increase of chromatin remodeling at the Foxp3 promoter, because a marked increase in acetylation at H3K9 was associated with an increase in Foxp3 transcription. Post septic splenic dendritic cells promoted Treg conversion in vitro. Using a solid tumor model to explore the function of Tregs in an in vivo setting, we found post septic mice showed an increase in tumor growth compared with sham-treated mice with a syngeneic tumor model. This observation could mechanistically be related to the ability of post septic Tregs to impair the antitumor response mediated by CD8(+) T cells. Together, these data show that the post septic immune system obstructs tumor immunosurveillance, in part, by augmented Treg expansion and function.


Figures

Figure 1
Figure 1
Significant reduction of total spleen and CD4+CD25 T cells after sham or CLP surgery. Severe sepsis was induced in C57BL/6 mice by CLP. (A) Total spleen cell number from CLP and sham mice is shown. (B-D) With the use of flow cytometry, the lymphocytes were gated by forward (FSC) and side (SSC) scatter properties, and, then, the expression of CD4 and CD25 molecules were analyzed. CD4+ T cells are shown according to their expression level of CD25 at days 1, 3, and 15 after surgery. (E) CD4+CD25 T cells that underwent FACS from sham and CLP at day 3 after surgery were stimulated with polyclonal anti-CD3/CD28 for 72 hours, and the levels of IL-10, IFN-γ, IL-13, and IL-4 were measured in the supernatants of these cultures by Bioplex. *P ≤ .05; **P ≤ .01; ***P ≤ .001, compared with sham surgery. (A-D) Data represent mean ± SEM of 3 independent experiments (n = 3-5 mice in both groups), and (E) data show pooled results from 2 independent experiments.
Figure 2
Figure 2
Characterization of Foxp3-expressing CD4+CD25+ T cells after sham or CLP surgery. (A-C) Spleens from sham and CLP mice at days 1, 3, and 15 after surgery were stained for CD4, CD25, and Foxp3. The percentage of Foxp3-expressing CD4 T cells with various CD25 expression is shown. (D) CD4+CD25 T cells were sorted from spleens of sham and CLP mice. Foxp3 expression was assayed by quantitative PCR, normalized to GAPDH levels, and compared with naive CD4+CD25-sorted cells. (E) Absolute numbers of CD4+CD25+Foxp3+ cells in spleens from sham and CLP mice. Combined data of 2 to 3 independent experiments and means ± SEM are shown. *P ≤ .05; **P ≤ .01; ***P ≤ .001 when CLP mice were compared with sham mice; #P ≤ .05 when CLP mice at day 3 were compared with CLP mice at day 15 after surgery. The levels (MFI) of (F) CTLA-4, (G) CD103, (H) GITR were analyzed in the population of CD4+CD25highFoxp3+ cells from spleens of sham and CLP mice at days 1, 3, and 15 after surgery. Data are representative of 2 independent experiments (n = 4-5 per group). *P ≤ .05; **P ≤ .01; ***P ≤ .001 when post septic mice were compared with sham mice.
Figure 3
Figure 3
Up-regulation of H3K9 acetylation in Foxp3 promoter CD4+CD25 T cells from post septic mice. (A) To determine histone acetylation and methylation status at the promoter region of Foxp3, ChIP assay was performed with 1.5 × 10⁶ FACS-purified CD4+CD25 T cells from post septic and sham mice at day 15 after surgery. (B) ChIP assay was performed with 1.5 × 10⁶ FACS-purified CD4+CD25 T cells from post septic and sham at day 15 after surgery to determine histone acetylation at H3K9 and H4K12. Numbers above bars indicate the fold change of enrichment after immunoprecipitation (IP) in post septic versus sham mice. Data are representative of 2 independent experiments (average and SEM; n = 4 mice per group). (C) mRNA expression of Kat2a, Kat5, and Kat2b in CD4+CD25 T cells from sham and post-CLP groups at day 1, 3, and 15 after surgery. Data from days 1 and 3 are the mean ± SEM from 6 mice in each group (2 spleens pooled at each time point). Data from day 15 are the mean ± SEM from 2 independent experiments (n = 6 for sham, n = 8 for post septic mice). *P ≤ .05, when post septic mice were compared with sham mice.
Figure 4
Figure 4
Suppressive properties of Tregs in post septic mice. (A) Representative CD4+CD25high cells used in suppression assays. Before coculture, Tregs were analyzed by FACS for intracellular Foxp3 expression (black line); isotype control (gray line). (B) CD4+CD25high T cells were isolated by FACS from the spleens of naive, sham, and CLP mice, and their suppressive capacities were tested in vitro. CD4+CD25 T cells from all groups that underwent FACS were cocultured with naive T cells as a control for the assay. CFDA-SE–labeled cells were examined by flow cytometry, and the magnitude of suppression of CFDA-SE–labeled naive T cells stimulated with anti-CD3/CD28 was calculated with the use of FlowJo software. The graphs represent mean ± SEM of the combined results from 2 to 3 experiments (for sham and CLP at 1, 3, and 15 days after surgery) and 2 independent experiments (for naive mice). #P ≤ .05; ###P ≤ .001 when the suppression activity of post septic Tregs was compared with naive Tregs. *P ≤ .05 and **P ≤ .01 when the suppression activity of post septic Tregs was compared with sham Tregs. (C-E) IFN-γ levels were analyzed in supernatants from cocultures. Data are mean ± SEM of results from 3 independent experiments at each time point. *P ≤ .05 compared with naive T-cell proliferation. (F) Cells from spleens of mice were analyzed for Foxp3 expression. Histogram plots were gated on CD4+CD25high cells, and the mean of fluorescence intensity (MFI) of Foxp3 was analyzed. Control isotype (dashed line), sham (gray area), and post septic (black line). Representative histograms are shown for 3 independent experiments with 3 to 4 mice per group.
Figure 5
Figure 5
Splenic DCs (CD11c+) from post septic mice potently induce Treg conversion. (A) Sham and post septic mice were administrated 0.8 mg/mL BrdU in the drinking water beginning 20 hours before the surgery, and at 48 hours the mice were injected intraperitoneally with 1 mg of BrdU per mouse. At day 3 after surgery, spleen cells were stained for CD4 and Foxp3, and the absolute numbers of CD4+Foxp3+BrdU+ cells were compared between sham and post septic groups from data obtained by flow cytometry. Data represent the mean ± SEM of 3 mice per group. *P ≤ .05, when sham mice are compared with post septic mice. (B-E) Naive CD4+Foxp3 T cells isolated from Foxp3eGFP mice underwent FACS and were cultured in Treg-polarizing conditions or not (ie, no transforming growth factor-β [TGF-β] served as negative control) with post septic or sham splenic DCs (CD11c+MHCII+ or CD8α+) or macrophages (CD11b+CD11c). The percentage of converted CD4+Foxp3+ T cells is shown (B). (C) Dot plots gated on viable CD4+GFP+ T cells show Foxp3 expression (FJK-16s) after culture in the presence of splenic DCs CD11c+ from sham or post septic mice; numbers in the upper quadrants indicate percentages of CD4+Foxp3 and CD4+Foxp3+ T-cell populations. (D) Percentage of conversion was analyzed on viable CD4+ T cells, and this panel shows the Foxp3 expression in the presence of post septic or sham splenic DCs incubated with blocking anti–IL-10 or IgG control (both 100 μg/mL). All converted Tregs expressed CD25. Data shown are representative of 2 independent experiments (n = 3-5 mice per group) with similar results. Data using DCs (CD11c+) are representative of 3 independent experiments with similar results. (E) The measurement of IFN-γ, KC, and IL-17 by Bioplex on the supernatants derived from the cell-culture conditions are shown as described in panel B.
Figure 6
Figure 6
Severe sepsis impaired effective antitumor responses. (A) At day 15 post septic and sham mice were inoculated subcutaneously in the flank with 0.5 × 10⁶ LLC cells, and tumor growth was monitored at various time points as indicated. Thus, day 15 is 30 days after CLP or sham surgery. Data shown are the results from 3 independent experiments. Horizontal lines indicate the comparison between sham and post-CLP mice at the indicated times after tumor injection. ns indicates not statistically significant. (B-C) IFN-γ, IL-17, TNF-α, and CCL5 were measured in tumor homogenates at days 11 and 20 after LLC injection with the use of Bioplex. (A) Pooled results from 3 independent experiments are shown. (B-C) Data represent the mean ± SEM from 5 to 7 individual mice per group. *P ≤ .05; ***P ≤ .001 when post septic mice were compared with sham mice bearing tumors.
Figure 7
Figure 7
CD4+Foxp3+ Tregs from post septic mice suppress antitumor responses in vivo. The immune response in tumor-draining LNs from sham and post septic mice (at day 15 after surgery) was analyzed at day 23 after LLC injection. (A) Comparative assessment of proportion of Foxp3+ Treg cells in total viable CD4+ T-cell population. (B) Dot plots gated in viable CD8+ T cells were analyzed for the intracellular expression of perforin × side scatter (SSC) in tumor-draining LNs from post septic and sham mice bearing tumor or in LNs without tumor. (A-B) Numbers in quadrants indicate percentage of cell types. (C) CD8+ gated T cells were analyzed for the expression of perforin in peripheral LNs from post septic and sham mice without tumor implantation. (D) The ratio between tumor-draining LNs, Tregs, and CD8+T lymphocytes producing IFN-γ (analyzed after TCR stimulation with anti-CD3/28) was compared between the groups. (C-D) Data represent the mean ± SEM from 5 individual mice per group. (E) Naive CD8+ T cells (5 × 10⁵) from C57BL/6 mice were transferred intravenously into C57BL/6 Rag−/− mice that 20 hours before were transferred with or without 0.9 × 10⁵ CD4+ FoxP3+ from FoxP3−eGFP knock-in mice T cells isolated from post septic (A) or sham mice (B). After 16 hours, 0.5 × 10⁶ LLC cells were subcutaneously injected, and the tumor measurements were performed at the indicated time points. Data are representative of 2 experiments with similar results. *P ≤ .05; **P ≤ .01 compared with sham Treg cells transferred in the presence of naive CD8+ T cells or only naive CD8+ T cells. No differences between the sham Tregs and CD8+ T cells or the CD8+ T-cell group alone were observed. Horizontal lines indicate comparison between panels A and B, and the comparison between panels A and C.

Comment in

  • Do Tregs link sepsis to tumor growth?
    Cuenca AG, Moldawer LL. Cuenca AG, et al. Blood. 2010 Jun 3;115(22):4324-5. doi: 10.1182/blood-2010-03-271379. Blood. 2010. PMID: 20522717 No abstract available.

References

    1. Angus DC, Linde-Zwirble WT, Lidicker J, Clermont G, Carcillo J, Pinsky MR. Epidemiology of severe sepsis in the United States: analysis of incidence, outcome, and associated costs of care. Crit Care Med. 2001;29(7):1303–1310. - PubMed
    1. Riedemann NC, Guo RF, Ward PA. The enigma of sepsis. J Clin Invest. 2003;112(4):460–467. - PMC - PubMed
    1. Wen H, Dou Y, Hogaboam CM, Kunkel SL. Epigenetic regulation of dendritic cell-derived interleukin-12 facilitates immunosuppression after a severe innate immune response. Blood. 2008;111(4):1797–1804. - PMC - PubMed
    1. Munoz C, Carlet J, Fitting C, Misset B, Bleriot JP, Cavaillon JM. Dysregulation of in vitro cytokine production by monocytes during sepsis. J Clin Invest. 1991;88(5):1747–1754. - PMC - PubMed
    1. Scumpia PO, Delano MJ, Kelly-Scumpia KM, et al. Treatment with GITR agonistic antibody corrects adaptive immune dysfunction in sepsis. Blood. 2007;110(10):3673–3681. - PMC - PubMed

Publication types

MeSH terms

Substances