Comparative Study
. 2010 Mar 4;464(7285):66-71.
doi: 10.1038/nature08834. Epub 2010 Feb 3.

Odorant reception in the malaria mosquito Anopheles gambiae

Affiliations
Comparative Study

Odorant reception in the malaria mosquito Anopheles gambiae

Allison F Carey et al. Nature. .

Abstract

The mosquito Anopheles gambiae is the major vector of malaria in sub-Saharan Africa. It locates its human hosts primarily through olfaction, but little is known about the molecular basis of this process. Here we functionally characterize the Anopheles gambiae odorant receptor (AgOr) repertoire. We identify receptors that respond strongly to components of human odour and that may act in the process of human recognition. Some of these receptors are narrowly tuned, and some salient odorants elicit strong responses from only one or a few receptors, suggesting a central role for specific transmission channels in human host-seeking behaviour. This analysis of the Anopheles gambiae receptors permits a comparison with the corresponding Drosophila melanogaster odorant receptor repertoire. We find that odorants are differentially encoded by the two species in ways consistent with their ecological needs. Our analysis of the Anopheles gambiae repertoire identifies receptors that may be useful targets for controlling the transmission of malaria.


Conflict of interest statement

Competing Interests

The authors declare no competing financial interests.

Figures
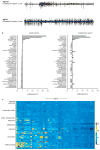
Figure 1
Figure 1. Functional characterization of the AgOrs
(a) Extracellular recordings from the empty neuron expressing an AgOr. Top, excitatory response of AgOr2 to 2-methylphenol; middle, excitatory response of AgOr21 to 6-methyl-5-hepten-2-one; bottom, inhibitory response of AgOr1 to 6-methyl-5-hepten-2-one. Action potentials from both neurons housed in the sensillum can be observed and distinguished by amplitude; the larger-amplitude action potential, from the ‘A’ neuron, expresses the AgOr, while the smaller-amplitude action potential, from the ‘B’ neuron, expresses its endogenous D. melanogaster odourant receptor. (b) Left, odourant response profile of AgOr8 expressed in the empty neuron. Right, odourant response profile of the An. gambiae neuron that houses AgOr8 (adapted from Lu, et al., 2007). All odourants were tested at a dilution of 10−2. The spontaneous firing rate and the responses to the diluent are subtracted from odourant responses in each panel. Of the 28 odourants that inhibited the spontaneous firing rate by 50% or more in the empty neuron, 21 gave mean responses that were negative in the endogenous An. gambiae neuron. Error bars represent SEM. (c) Heat map of responses of the 50 functional AgOrs to 110 odourants. Response intensity is colour-coded according to the continuous colour scale on the right and represents the mean activity measured over a 0.5 second odourant stimulation period. Receptors, odourants, and numerical values are indicated in Supplementary Table 2. n = 5–6; for odourants that elicit responses ≥100 spikes/second, n = 6. Spontaneous activity and responses to diluent have been subtracted from response values. All odourants were tested at a 10−2 dilution. Odourants containing both a phenol ring and an ester moiety are classified as aromatics; terpenes containing an ester moiety are classified as terpenes.
Figure 2
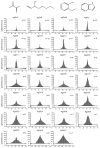
Figure 2. Tuning breadths of receptors
Tuning curves for the AgOrs that respond strongly (≥100 spikes/second) to at least one odourant on the panel. The 110 odourants are arranged along the X-axis according to the strength of the response they elicit from each receptor. The odourants that elicit the strongest responses are placed near the center of the distribution; those that elicit the weakest responses are placed near the edges. The order of odourants is therefore different for each receptor. The kurtosis value k, a statistical measure of “peakedness,” is located in the upper right corner of each plot. Structures of odourants that elicit strong responses from the most narrowly tuned AgOrs: 2,3-butanedione (AgOr5); 1-octen-3-ol (AgOr8); 2-ethylphenol (AgOr65); indole (AgOr2) are shown above the receptors they activate.
Figure 3
Figure 3. Odourant tuning curves
Tuning curves for odourants. The responses of the 50 AgOrs are ordered along the X-axis according to the magnitude of the response they generate for each odourant. The receptor with the strongest response is placed at the center of the distribution; those that have the weakest responses are at the edges. The order of receptors is therefore different for each odourant. The kurtosis value is indicated in each graph. Only odourants that generate a strong response (≥100 spikes/second) from at least one receptor are shown. At the top of the panel are the structures of several odourants that generate strong responses from just one or two receptors, shown above the corresponding graph. Shown here are tuning curves for the 12 most narrowly tuned odorants, the 12 most broadly tuned odorants, and 12 representative odorants of intermediate tuning breadth. Tuning curves for 25 additional odourants are shown in Supplementary Figure 3.
Figure 4
Figure 4. Distribution of responses across a physicochemical odour space
(a) Bubble plot of the responses generated by the AgOr repertoire to each of the 110 odourants. Size of the bubble scales with the sum of spikes across all receptors that exhibit at least one response ≥50 spikes/second from at least one odourant on the panel. Each odourant is plotted and colour-coded according to functional group except for 7-octenoic acid and 2-oxohexenoic acid. Shown are the first two principal components of the 32-dimensional physicochemical space (adapted from Haddad, et al., 2008). Descriptors were normalized. Comparison of responses generated by the AgOrs (b) and DmOrs (c) to the set of 53 odourants that were tested against both receptor repertoires. Area of the bubble corresponds to the sum of spikes across all receptors that exhibit at least one response ≥50 spikes/second from at least one odourant on the panel. Responses were normalized to the sum of spikes elicited by all 53 odourants across all AgOrs or all DmOrs that exhibit at least one response ≥50 spikes/second from at least one odourant on the panel. (d) Percent of odourant-receptor combinations that generate strong responses (≥100 spikes/second) within the ester and aromatic classes for An. gambiae and D. melanogaster. Only responsive receptors (those yielding a response ≥50 spikes/second to at least one odourant) were considered.
Figure 5
Figure 5. Distribution of odourants in a receptor activity-based odour space
First three principal components of a receptor activity-based odour space. (a) Left, An. gambiae odour space. Right, D. melanogaster odour space (adapted from Hallem and Carlson, 2006). All odourants tested against a receptor set were considered. Odourants are colour-coded according to functional group. (b) Only esters are shown. Left, An. gambiae odour space; right D. melanogaster odour space. (c) Only aromatics shown. Left, An. gambiae odour space; right D. melanogaster odour space. Mean inter-odourant distance for the set of esters tested against both receptor sets is 254±12 spikes/second for the AgOrs; 353±13 spikes/second for the DmOrs (p<0.05; t-test). Mean inter-odourant distance for the set of aromatics tested against both receptor sets is 406±29 for the AgOrs; 321±17 for the DmOrs (p<0.05; t-test).

Comment in

Similar articles

Cited by

References

    1. World Health Organization. World Malaria Report. 2008.
    1. Zwiebel LJ, Takken W. Olfactory regulation of mosquito-host interactions. Insect Biochem Mol Biol. 2004;34:645–52. - PMC - PubMed
    1. Takken W. The Role of Olfaction in Host-Seeking of Mosquitos - a Review. Insect Science and Its Application. 1991;12:287–295.
    1. Takken W, Knols BGJ. Odor-mediated behavior of Afrotropical malaria mosquitoes. Annual Review of Entomology. 1999;44:131–157. - PubMed
    1. Su CY, Menuz K, Carlson JR. Olfactory perception: receptors, cells, and circuits. Cell. 2009;139:45–59. - PMC - PubMed

Publication types

MeSH terms

Substances