. 2010 Jan 6:3:67.
doi: 10.3389/neuro.09.067.2009. eCollection 2010.

Early Visually Evoked Electrophysiological Responses Over the Human Brain (P1, N170) Show Stable Patterns of Face-Sensitivity from 4 years to Adulthood

Affiliations

Early Visually Evoked Electrophysiological Responses Over the Human Brain (P1, N170) Show Stable Patterns of Face-Sensitivity from 4 years to Adulthood

Dana Kuefner et al. Front Hum Neurosci. .

Abstract

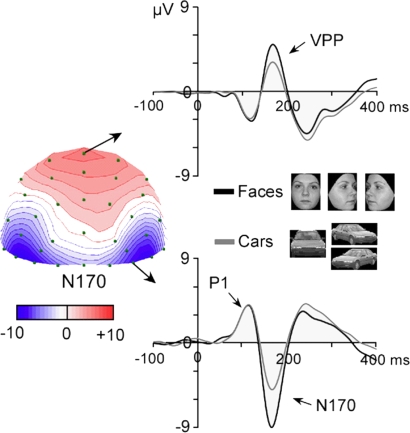
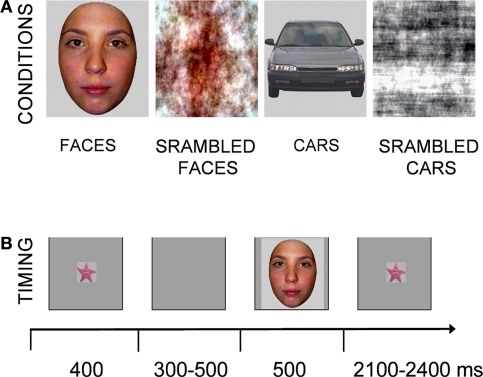
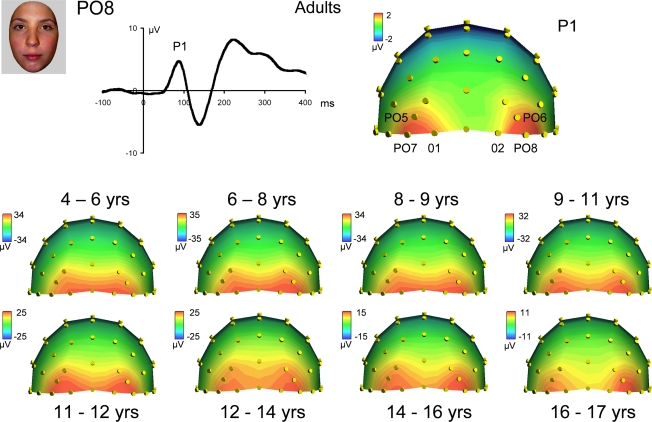
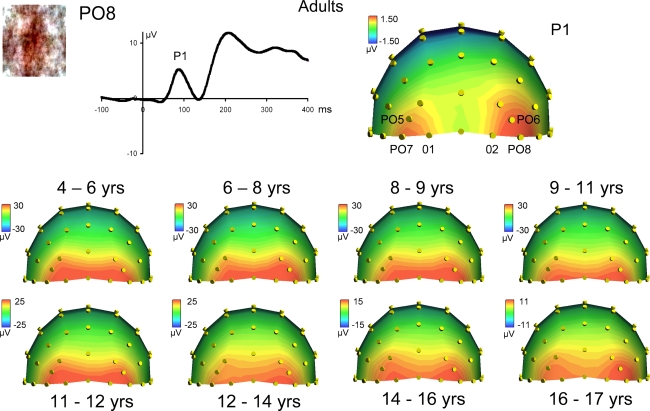
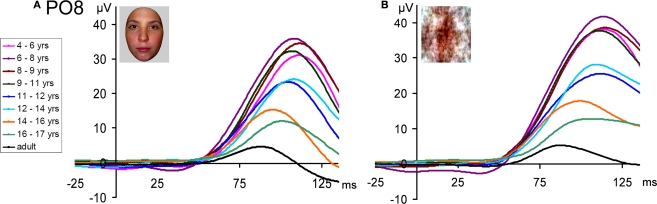
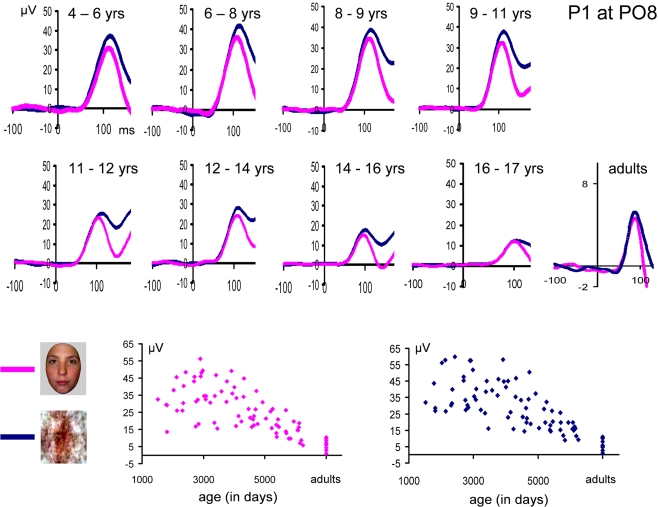
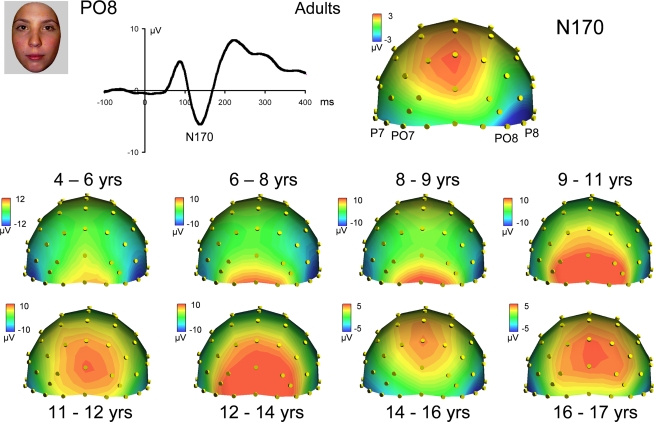
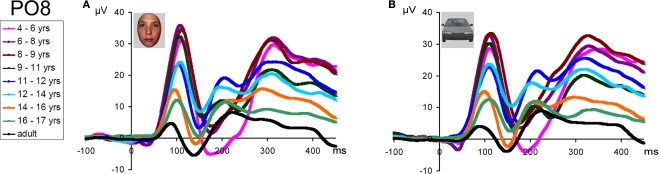
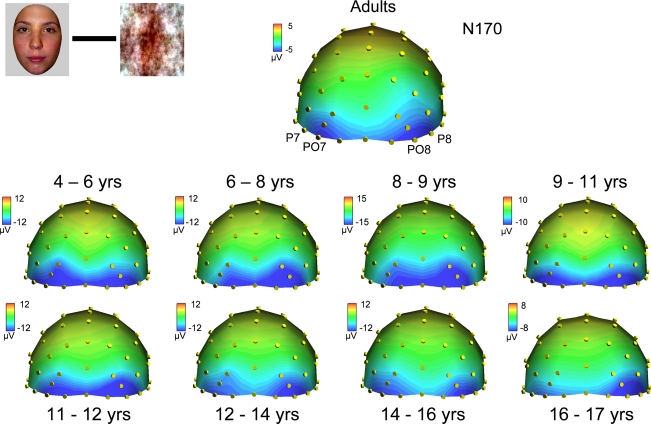
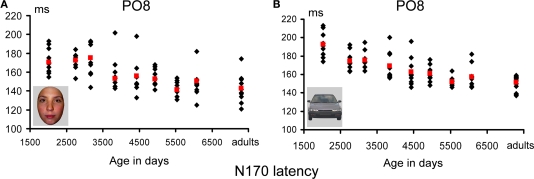
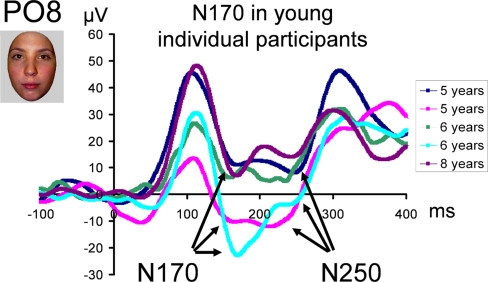
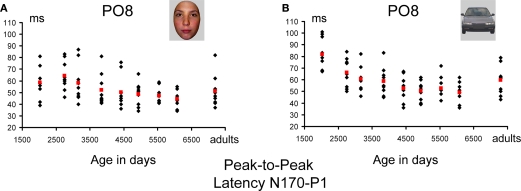
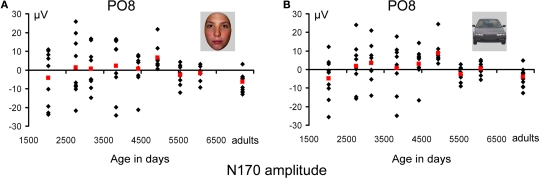
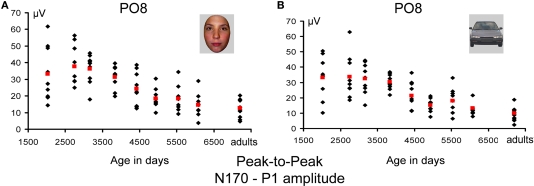
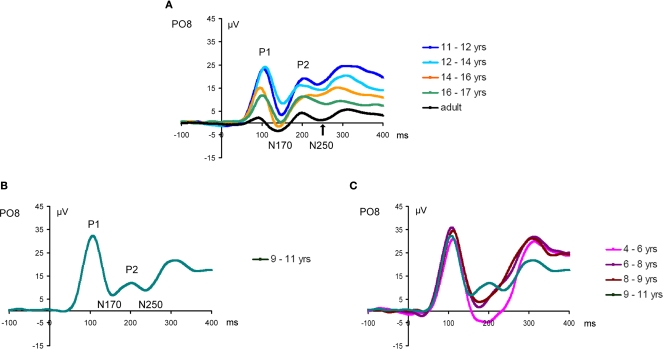
Whether the development of face recognition abilities truly reflects changes in how faces, specifically, are perceived, or rather can be attributed to more general perceptual or cognitive development, is debated. Event-related potential (ERP) recordings on the scalp offer promise for this issue because they allow brain responses to complex visual stimuli to be relatively well isolated from other sensory, cognitive and motor processes. ERP studies in 5- to 16-year-old children report large age-related changes in amplitude, latency (decreases) and topographical distribution of the early visual components, the P1 and the occipito-temporal N170. To test the face specificity of these effects, we recorded high-density ERPs to pictures of faces, cars, and their phase-scrambled versions from 72 children between the ages of 4 and 17, and a group of adults. We found that none of the previously reported age-dependent changes in amplitude, latency or topography of the P1 or N170 were specific to faces. Most importantly, when we controlled for age-related variations of the P1, the N170 appeared remarkably similar in amplitude and topography across development, with much smaller age-related decreases in latencies than previously reported. At all ages the N170 showed equivalent face-sensitivity: it had the same topography and right hemisphere dominance, it was absent for meaningless (scrambled) stimuli, and larger and earlier for faces than cars. The data also illustrate the large amount of inter-individual and inter-trial variance in young children's data, which causes the N170 to merge with a later component, the N250, in grand-averaged data. Based on our observations, we suggest that the previously reported "bi-fid" N170 of young children is in fact the N250. Overall, our data indicate that the electrophysiological markers of face-sensitive perceptual processes are present from 4 years of age and do not appear to change throughout development.

Keywords: ERP; N170; development; face recognition.


Figures

Figure 1
Figure 1
Adapted from Rossion and Jacques (2008). The N170 is a negative component recorded from posterior lateral electrode sites following the presentation of faces and object stimuli from various categories (here pictures of cars). It peaks at about 160–170 ms following stimulus onset and is recorded between 130 and 200 ms. It is most prominent at the lowest occipito-temporal electrode sites, usually maximal on channels P8(T6) or PO8, or lower channels in this area. The component is larger in response to faces than objects in both hemispheres, with usually a larger response in the right hemisphere. The N170 is associated with a temporally coincident positivity on the vertex (CZ), the vertex positive potential (VPP), which shows identical response properties and largely reflect the projection of the occipito-temporal dipolar sources to the vertex (see Joyce and Rossion, 2005). The data presented are grand averages of 20 adult subjects presented with full-front and 3/4 profiles pictures averaged together.
Figure 2
Figure 2
(A) Examples of stimuli used in this study, faces, phase-scrambled faces, cars and scrambled cars. (B) Timeline of the events during the recording of event-related potentials.
Figure 3
Figure 3
Scalp topographies at the peak of the visual P1 component in responses to faces in adults (top) and all age groups. Note the increasing separation of the lateral occipital sources generating the P1.This variation may be due to changes in head size across development. The topographic plots are snapshots of the P1 response at 90 ms for adults, and at the following latencies for the youngest to oldest age groups, respectively: 109, 108, 111, 104, 105, 108, 95 and 102 ms.
Figure 4
Figure 4
Scalp topographies at the peak of the visual P1 component in responses to scrambled faces in adults (top) and all age groups. Note the increasing separation of the lateral occipital sources generating the P1, and the general similarity with the changes observed for faces (Figure 3). The topographic plots are snapshots of the P1 response at 100 ms for adults, and at the following latencies for the youngest to oldest age groups, respectively: 116, 113, 115, 111, 111, 109, 99 and 110 ms.
Figure 5
Figure 5
The P1 recorded from PO8 (right lateral occipital site) for the 8 age groups and adults, illustrating the large changes in latency (linear decrease) and amplitude (overall decrease). (A) In response to faces. (B) In response to scrambled faces. Note the larger amplitude to scrambled faces, and the overall similarity of developmental changes for faces and scrambled faces. A 30-Hz low-pass filter has been applied to each waveform in this figure.
Figure 6
Figure 6
The P1 recorded from PO8 (right lateral occipital site) for the 8 age groups and adults, illustrating the larger response to scrambled faces as compared to faces, which remained constant all along development. The waveforms above are based on grand-averaged data from nine subjects in each group, while the individual data of each participant in the study are shown below. Children's data is plotted according to participant age in days at the time of test. Note the progressive decrease in amplitude with age, both for faces and scrambled faces, and the inter-individual variance in amplitude of the component. A 30-Hz low-pass filter has been applied to each waveform in this figure.
Figure 7
Figure 7
Scalp topographies at the peak of the visual face-sensitive N170 component in responses to faces in adults (top) and all age groups. Note the large variations in scalp distribution of the raw N170 component, which becomes adult-like at about 14–16 years old only. Right lateralization is clear only in adult data on this topography. The topographic plots are snapshots of the N170 response at 139 ms for adults, and at the following latencies for the youngest to oldest age groups, respectively: 166, 180, 185, 156, 150, 153, 143 and 148 ms.
Figure 8
Figure 8
Grand-average waveform in response to (A) faces and (B) cars in all age groups and adults (in black) illustrating the dramatic differences of amplitude, latency and width of the N170 component. Note that, especially evident for the face stimuli, in the three youngest age groups the component is particularly wide due to the merging in grand-averaged data of the N170 with a late negative deflection. This phenomenon can be clearly observed on individual data (Figure 11). A 30-Hz low-pass filter has been applied to each waveform in this figure.
Figure 9
Figure 9
Scalp topographies at the peak of the visual face-sensitive N170 component in responses to faces in adults (top) and all age groups, when the response to scrambled faces at that latency is subtracted out. Compared to the large variations in scalp distribution of the raw N170 component (Figure 7), the N170 shows a remarkable stability in terms of topography across all age groups, with a very small refinement with age. Note that the right hemisphere dominance, characteristic of the adult face N170, is visible in most age groups, at least from 6 to 8 years old. The topographic plots are snapshots of the (face – scrambled face) subtracted N170 response at 180 ms for adults, and at the following latencies for the youngest to oldest age groups, respectively: 166, 180, 190, 148, 150, 163, 143 and 159 ms.
Figure 10
Figure 10
Peak latency of the N170 in response to pictures of faces (A) and cars (B). Individual data points are plotted according to the mean age (in days) of each age group. Mean latency for each age group is shown in red. The overall latency delay for cars was found across all age groups, and the developmental decrease of latency appears to follow a similar pattern for faces and cars. Note the longer latency of the N170 in the three youngest age groups compared to the others, but also the generally smaller variability (25 ms at most). The N170 latency appears to reach an adult-like level at 14–16 years old, both for faces and cars.
Figure 11
Figure 11
Illustration of young individual participant waveforms showing the two negative deflections which are merged on grand averaged data (Figure 8). The second peak may correspond to the N250 in older populations (see text and Supplementary Material). A 30-Hz low-pass filter has been applied to each waveform in this figure.
Figure 12
Figure 12
Peak-to-peak latency measurements of the N170 vs. P1 for faces (A) and cars (B). Individual data points are plotted according to the mean age (in days) of each age group. Mean measurements for each age group are shown in red. If anything, the changes of latency with age were larger for pictures of cars (due to the youngest children). For faces, the peak-to-peak difference in latency between the P1 and N170 was of 10–15 ms at most.
Figure 13
Figure 13
Amplitude measurements of the N170 for faces (A) and cars (B). Individual data points are plotted according to the mean age (in days) of each age group. Mean measurements for each age group are shown in red. The U-shape function of N170 amplitude is not so clear on the figure due to the large scale used to display individual participant's data. Note the remarkable similarity between the amplitude variations of faces and cars with age.
Figure 14
Figure 14
Amplitude measurements of the N170 – P1 for faces (A) and cars (B) (absolute values). Individual data points are plotted according to the mean age (in days) of each age group. Mean measurements for each age group are shown in red. The U-shape function of N170 amplitude is no longer there, and the age-related variations reflecting the processes taking place following the P1 show only a slight decrease with age, similar for faces and cars.
Figure 15
Figure 15
(A) Grand-average waveform recorded at PO8 in response to faces in the four oldest age groups and adults. Note the separation of the N170 and N250 by the clear presence of the P2. (B) The grand-average waveform for the 9–11 year olds. Note that the P2 is less pronounced for this age group. (C) Grand-average waveforms recorded at PO8 in response to faces in the three youngest age groups (4–6 years, 6–8 years, 8–9 years) compared to the 9–11 year olds. Note that there is no P2 in the three youngest groups and that the “N170”, as evident from the grand means, encompasses both the N170 and N250 of the older age group. The peak of the N170 for these three youngest age groups falls close to where the Peak of the P2 is for 9–11 year olds. This leads us to believe that in the grand averaged data, the N170 and N250 are merged in the three youngest age groups due to large inter-subject variability and the absence of a pronounced P2.

Similar articles

Cited by

References

    1. Aylward E. H., Park J. E., Field K. M., Parsons A. C., Richards T. L., Cramer S. C., Meltzoff A. N. (2005). Brain activation during face perception: evidence of a developmental change. J. Cogn. Neurosci. 17, 308–31910.1162/0898929053124884 - DOI - PubMed
    1. Batty M., Taylor M. J. (2006). The development of emotional face processing during childhood. Dev. Sci. 9, 2, 207–22010.1111/j.1467-7687.2006.00480.x - DOI - PubMed
    1. Begleiter H., Porjesz B., Wang W. (1995). Event-related brain potentials differentiate priming and recognition to familiar and unfamiliar faces. Electroencephalogr. Clin. Neurophysiol. 94, 41–4910.1016/0013-4694(94)00240-L - DOI - PubMed
    1. Bentin S., McCarthy G., Perez E., Puce A., Allison T. (1996). Electrophysiological studies of face perception in humans. J. Cogn. Neurosci. 8, 551–56510.1162/jocn.1996.8.6.551 - DOI - PMC - PubMed
    1. Betts J., Mckay J., Maruff P., Anderson V. (2006). The development of sustained attention in children: the effect of age and task load. Child Neuropsychol. 12, 205–22110.1080/09297040500488522 - DOI - PubMed

LinkOut - more resources