

Tropomyosin period 3 is essential for enhancement of isometric tension in thin filament-reconstituted bovine myocardium
- PMID: 20130792
- PMCID: PMC2814127
- DOI: 10.1155/2009/380967
Tropomyosin period 3 is essential for enhancement of isometric tension in thin filament-reconstituted bovine myocardium
Abstract
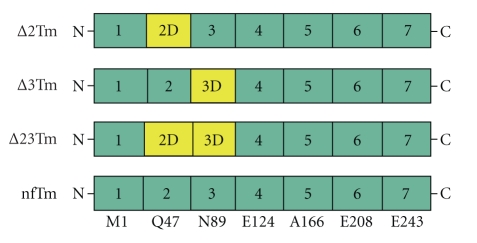
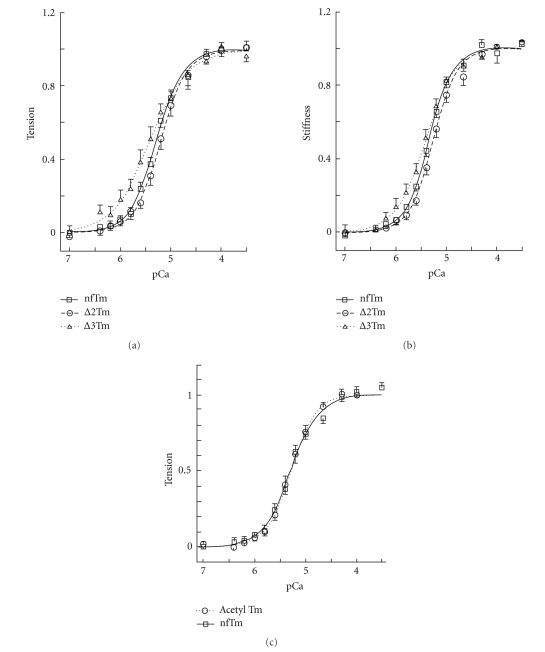
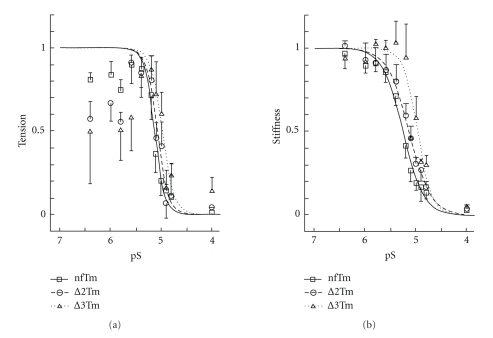
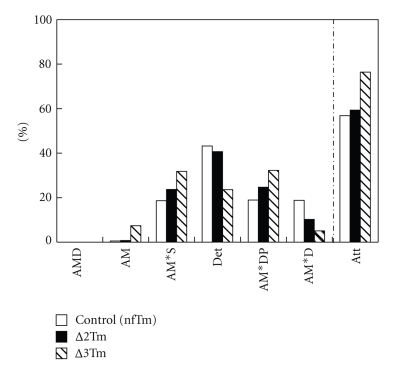
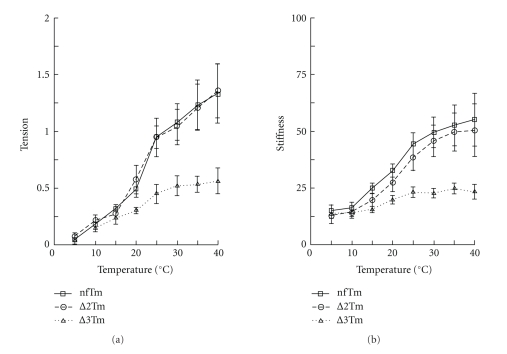
Tropomyosin (Tm) consists of 7 quasiequivalent repeats known as "periods," and its specific function may be associated with these periods. To test the hypothesis that either period 2 or 3 promotes force generation by inducing a positive allosteric effect on actin, we reconstituted the thin filament with mutant Tm in which either period 2 (Delta2Tm) or period 3 (Delta3Tm) was deleted. We then studied: isometric tension, stiffness, 6 kinetic constants, and the pCa-tension relationship. N-terminal acetylation of Tm did not cause any differences. The isometric tension in Delta2Tm remained unchanged, and was reduced to approximately 60% in Delta3Tm. Although the kinetic constants underwent small changes, the occupancy of strongly attached cross-bridges was not much different. The Hill factor (cooperativity) did not differ significantly between Delta2Tm (1.79 +/- 0.19) and the control (1.73 +/- 0.21), or Delta3Tm (1.35 +/- 0.22) and the control. In contrast, pCa(50) decreased slightly in Delta2Tm (5.11 +/- 0.07), and increased significantly in Delta3Tm (5.57 +/- 0.09) compared to the control (5.28 +/- 0.04). These results demonstrate that, when ions are present at physiological concentrations in the muscle fiber system, period 3 (but not period 2) is essential for the positive allosteric effect that enhances the interaction between actin and myosin, and increases isometric force of each cross-bridge.
Figures
Similar articles
-
Effects of tropomyosin internal deletion Delta23Tm on isometric tension and the cross-bridge kinetics in bovine myocardium.J Physiol. 2003 Dec 1;553(Pt 2):457-71. doi: 10.1113/jphysiol.2003.053694. Epub 2003 Sep 18. J Physiol. 2003. PMID: 14500764 Free PMC article.
-
The role of tropomyosin domains in cooperative activation of the actin-myosin interaction.J Mol Biol. 2011 Dec 16;414(5):667-80. doi: 10.1016/j.jmb.2011.10.026. Epub 2011 Oct 20. J Mol Biol. 2011. PMID: 22041451 Free PMC article.
-
Temperature-dependence of isometric tension and cross-bridge kinetics of cardiac muscle fibers reconstituted with a tropomyosin internal deletion mutant.Biophys J. 2006 Dec 1;91(11):4230-40. doi: 10.1529/biophysj.106.084608. Epub 2006 Sep 15. Biophys J. 2006. PMID: 16980359 Free PMC article.
-
Regulation of contraction in striated muscle.Physiol Rev. 2000 Apr;80(2):853-924. doi: 10.1152/physrev.2000.80.2.853. Physiol Rev. 2000. PMID: 10747208 Review.
-
A study of tropomyosin's role in cardiac function and disease using thin-filament reconstituted myocardium.J Muscle Res Cell Motil. 2013 Aug;34(3-4):295-310. doi: 10.1007/s10974-013-9343-z. Epub 2013 May 23. J Muscle Res Cell Motil. 2013. PMID: 23700264 Free PMC article. Review.
Cited by
-
DCM-related tropomyosin mutants E40K/E54K over-inhibit the actomyosin interaction and lead to a decrease in the number of cycling cross-bridges.PLoS One. 2012;7(10):e47471. doi: 10.1371/journal.pone.0047471. Epub 2012 Oct 15. PLoS One. 2012. PMID: 23077624 Free PMC article.
-
The role of tropomyosin isoforms and phosphorylation in force generation in thin-filament reconstituted bovine cardiac muscle fibres.J Muscle Res Cell Motil. 2010 Aug;31(2):93-109. doi: 10.1007/s10974-010-9213-x. Epub 2010 Jun 18. J Muscle Res Cell Motil. 2010. PMID: 20559861 Free PMC article.
-
A periodic pattern of evolutionarily conserved basic and acidic residues constitutes the binding interface of actin-tropomyosin.J Biol Chem. 2013 Apr 5;288(14):9602-9609. doi: 10.1074/jbc.M113.451161. Epub 2013 Feb 18. J Biol Chem. 2013. PMID: 23420843 Free PMC article.
-
Analysis of the molecular pathogenesis of cardiomyopathy-causing cTnT mutants I79N, ΔE96, and ΔK210.Biophys J. 2013 May 7;104(9):1979-88. doi: 10.1016/j.bpj.2013.04.001. Biophys J. 2013. PMID: 23663841 Free PMC article.
-
Regulation of actin-myosin interaction by conserved periodic sites of tropomyosin.Proc Natl Acad Sci U S A. 2012 Nov 6;109(45):18425-30. doi: 10.1073/pnas.1212754109. Epub 2012 Oct 22. Proc Natl Acad Sci U S A. 2012. PMID: 23091026 Free PMC article.
References
-
- McLachlan AD, Stewart M. The 14 fold periodicity in α-tropomyosin and the interaction with actin. Journal of Molecular Biology. 1976;103(2):271–298. - PubMed
-
- Parry DA. Analysis of the primary sequence of alpha-tropomyosin from rabbit skeletal muscle. Journal of Molecular Biology. 1975;519:p. 35. - PubMed
-
- Phillips GN., Jr. Construction of an atomic model for tropomyosin and implications for interactions with actin. Journal of Molecular Biology. 1986;192(1):128–131. - PubMed
-
- Chalovich JM. Actin mediated regulation of muscle contraction. Pharmacology and Therapeutics. 1992;55(2):95–148. - PubMed
Grants and funding
LinkOut - more resources
Full Text Sources
