

Statistical analysis of variation in the human plasma proteome
- PMID: 20130815
- PMCID: PMC2814230
- DOI: 10.1155/2010/258494
Statistical analysis of variation in the human plasma proteome
Abstract
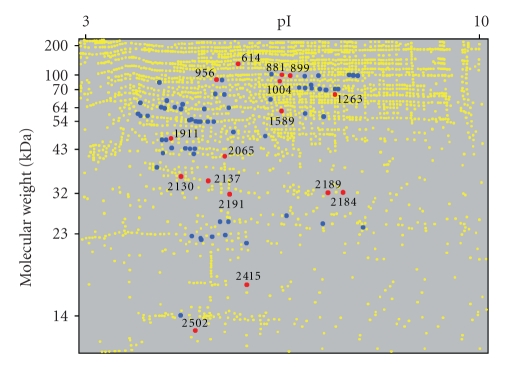
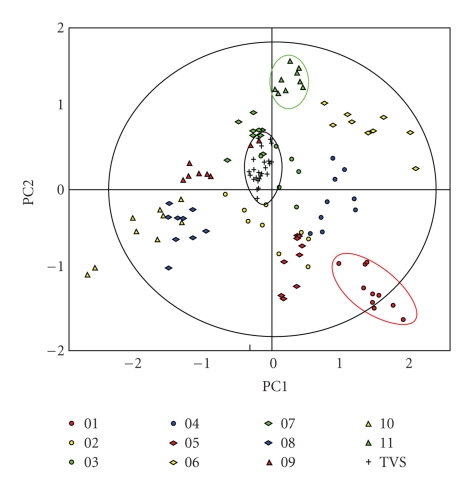
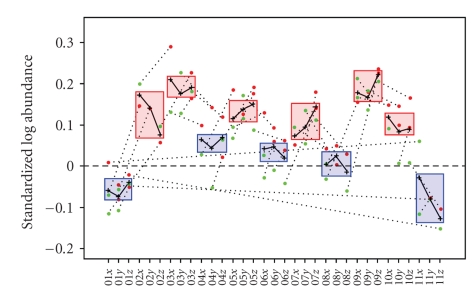
Quantifying the variation in the human plasma proteome is an essential prerequisite for disease-specific biomarker detection. We report here on the longitudinal and individual variation in human plasma characterized by two-dimensional difference gel electrophoresis (2-D DIGE) using plasma samples from eleven healthy subjects collected three times over a two week period. Fixed-effects modeling was used to remove dye and gel variability. Mixed-effects modeling was then used to quantitate the sources of proteomic variation. The subject-to-subject variation represented the largest variance component, while the time-within-subject variation was comparable to the experimental variation found in a previous technical variability study where one human plasma sample was processed eight times in parallel and each was then analyzed by 2-D DIGE in triplicate. Here, 21 protein spots had larger than 50% CV, suggesting that these proteins may not be appropriate as biomarkers and should be carefully scrutinized in future studies. Seventy-eight protein spots showing differential protein levels between different individuals or individual collections were identified by mass spectrometry and further characterized using hierarchical clustering. The results present a first step toward understanding the complexity of longitudinal and individual variation in the human plasma proteome, and provide a baseline for improved biomarker discovery.
Figures


Similar articles
-
Statistical analysis of the experimental variation in the proteomic characterization of human plasma by two-dimensional difference gel electrophoresis.J Proteome Res. 2006 Oct;5(10):2611-9. doi: 10.1021/pr060100p. J Proteome Res. 2006. PMID: 17022632
-
Investigation of the efficacy of albumin removal procedures on porcine serum proteome profile.J Anim Sci. 2015 Apr;93(4):1592-8. doi: 10.2527/jas.2014-8559. J Anim Sci. 2015. PMID: 26020181
-
Characterization of proteins in human pancreatic cancer serum using differential gel electrophoresis and tandem mass spectrometry.J Proteome Res. 2005 Sep-Oct;4(5):1742-51. doi: 10.1021/pr050174l. J Proteome Res. 2005. PMID: 16212428
-
Numerical approaches for quantitative analysis of two-dimensional maps: a review of commercial software and home-made systems.Proteomics. 2005 Feb;5(3):654-66. doi: 10.1002/pmic.200401015. Proteomics. 2005. PMID: 15669000 Review.
-
Serum and plasma proteomics and its possible use as detector and predictor of radiation diseases.Adv Exp Med Biol. 2013;990:61-86. doi: 10.1007/978-94-007-5896-4_4. Adv Exp Med Biol. 2013. PMID: 23378003 Review.
Cited by
-
Proteomic sample preparation for blast wound characterization.Proteome Sci. 2014 Feb 14;12(1):10. doi: 10.1186/1477-5956-12-10. Proteome Sci. 2014. PMID: 24529238 Free PMC article.
-
Characterization and non-parametric modeling of the developing serum proteome during infancy and early childhood.Sci Rep. 2018 Apr 12;8(1):5883. doi: 10.1038/s41598-018-24019-5. Sci Rep. 2018. PMID: 29650987 Free PMC article.
-
Platelets, a reliable source for peripheral Alzheimer's disease biomarkers?Acta Neuropathol Commun. 2014 Jun 16;2:65. doi: 10.1186/2051-5960-2-65. Acta Neuropathol Commun. 2014. PMID: 24934666 Free PMC article. Review.
-
Concordant release of glycolysis proteins into the plasma preceding a diagnosis of ER+ breast cancer.Cancer Res. 2012 Apr 15;72(8):1935-42. doi: 10.1158/0008-5472.CAN-11-3266. Epub 2012 Feb 24. Cancer Res. 2012. PMID: 22367215 Free PMC article.
-
Interindividual variation in the proteome of human peripheral blood mononuclear cells.PLoS One. 2013 Apr 11;8(4):e61933. doi: 10.1371/journal.pone.0061933. Print 2013. PLoS One. 2013. PMID: 23613975 Free PMC article.
References
-
- Nedelkov D. Population proteomics: addressing protein diversity in humans. Expert Review of Proteomics. 2005;2(3):315–324. - PubMed
-
- Hermjakob H. The HUPO proteomics standards initiative—overcoming the fragmentation of proteomics data. Proteomics. 2006;1(S2):34–38. - PubMed
-
- Taylor CF. Minimum reporting requirements for proteomics: a MIAPE primer. Proteomics. 2006;1(S2):39–44. - PubMed
-
- Omenn GS. Exploring the human plasma proteome: editorial. Proteomics. 2005;5(13):3223–3225. - PubMed
-
- Omenn GS, Paik Y-K, Speicher D. The HUPO plasma proteome project: a report from the Munich congress. Proteomics. 2006;6(1):9–11. - PubMed
Publication types
MeSH terms
Substances
LinkOut - more resources
Full Text Sources
