

Identification of N-glycans from Ebola virus glycoproteins by matrix-assisted laser desorption/ionisation time-of-flight and negative ion electrospray tandem mass spectrometry
- PMID: 20131323
- PMCID: PMC3399782
- DOI: 10.1002/rcm.4410
Identification of N-glycans from Ebola virus glycoproteins by matrix-assisted laser desorption/ionisation time-of-flight and negative ion electrospray tandem mass spectrometry
Abstract
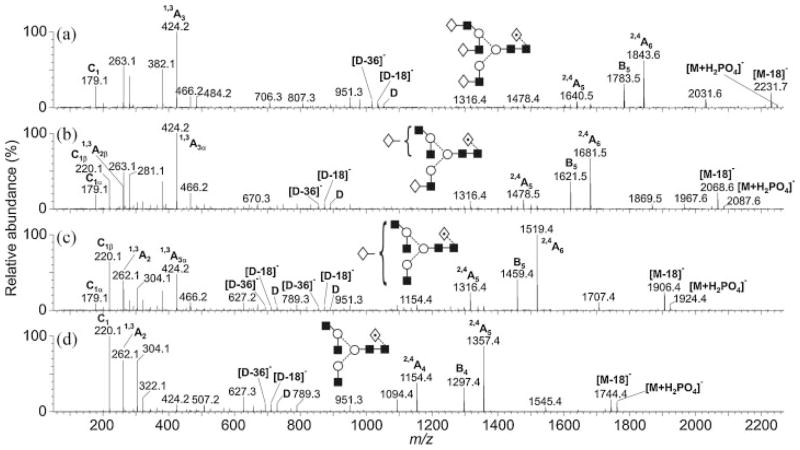
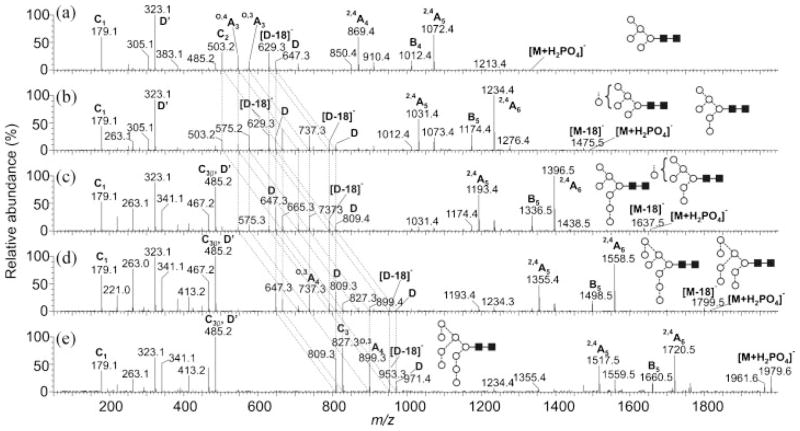
The larger fragment of the transmembrane glycoprotein (GP1) and the soluble glycoprotein (sGP) of Ebola virus were expressed in human embryonic kidney cells and the secreted products were purified from the supernatant for carbohydrate analysis. The N-glycans were released with PNGase F from within sodium dodecyl sulphate/polyacrylamide gel electrophoresis (SDS-PAGE) gels. Identification of the glycans was made with normal-phase high-performance liquid chromatography (HPLC), matrix-assisted laser desorption/ionisation mass spectrometry, negative ion electrospray ionisation fragmentation mass spectrometry and exoglycosidase digestion. Most glycans were complex bi-, tri- and tetra-antennary compounds with reduced amounts of galactose. No bisected compounds were detected. Triantennary glycans were branched on the 6-antenna; fucose was attached to the core GlcNAc residue. Sialylated glycans were present on sGP but were largely absent from GP1, the larger fragment of the transmembrane glycoprotein. Consistent with this was the generally higher level of processing of carbohydrates found on sGP as evidenced by a higher percentage of galactose and lower levels of high-mannose glycans than were found on GP1. These results confirm and expand previous findings on partial characterisation of the Ebola virus transmembrane glycoprotein. They represent the first detailed data on carbohydrate structures of the Ebola virus sGP.
Copyright 2010 John Wiley & Sons, Ltd.
Figures
Similar articles
-
Application of negative ion MS/MS to the identification of N-glycans released from carcinoembryonic antigen cell adhesion molecule 1 (CEACAM1).J Mass Spectrom. 2009 Jan;44(1):50-60. doi: 10.1002/jms.1470. J Mass Spectrom. 2009. PMID: 18788072
-
Structural determination of N-linked carbohydrates by matrix-assisted laser desorption/ionization-mass spectrometry following enzymatic release within sodium dodecyl sulphate-polyacrylamide electrophoresis gels: application to species-specific glycosylation of alpha1-acid glycoprotein.Electrophoresis. 1998 Aug;19(11):1950-9. doi: 10.1002/elps.1150191113. Electrophoresis. 1998. PMID: 9740055
-
Identification of N-linked carbohydrates from severe acute respiratory syndrome (SARS) spike glycoprotein.Virology. 2010 Apr 10;399(2):257-69. doi: 10.1016/j.virol.2009.12.020. Epub 2010 Feb 2. Virology. 2010. PMID: 20129637 Free PMC article.
-
Structural determination of N-linked glycans by matrix-assisted laser desorption/ionization and electrospray ionization mass spectrometry.Proteomics. 2005 May;5(7):1774-86. doi: 10.1002/pmic.200401248. Proteomics. 2005. PMID: 15832364 Review.
-
NEGATIVE ION MASS SPECTROMETRY FOR THE ANALYSIS OF N-LINKED GLYCANS.Mass Spectrom Rev. 2020 Sep;39(5-6):586-679. doi: 10.1002/mas.21622. Epub 2020 Apr 24. Mass Spectrom Rev. 2020. PMID: 32329121 Review.
Cited by
-
Enhancement of Ebola Virus Infection via Ficolin-1 Interaction with the Mucin Domain of GP Glycoprotein.J Virol. 2016 May 12;90(11):5256-5269. doi: 10.1128/JVI.00232-16. Print 2016 Jun 1. J Virol. 2016. PMID: 26984723 Free PMC article.
-
Large-Scale Synthesis of Man9GlcNAc2 High-Mannose Glycan and the Effect of the Glycan Core on Multivalent Recognition by HIV Antibody 2G12.ACS Infect Dis. 2022 Nov 11;8(11):2232-2241. doi: 10.1021/acsinfecdis.2c00442. Epub 2022 Oct 24. ACS Infect Dis. 2022. PMID: 36278940 Free PMC article.
-
The Epstein-Barr Virus Glycoprotein gp150 Forms an Immune-Evasive Glycan Shield at the Surface of Infected Cells.PLoS Pathog. 2016 Apr 14;12(4):e1005550. doi: 10.1371/journal.ppat.1005550. eCollection 2016 Apr. PLoS Pathog. 2016. PMID: 27077376 Free PMC article.
-
The secret life of viral entry glycoproteins: moonlighting in immune evasion.PLoS Pathog. 2013;9(5):e1003258. doi: 10.1371/journal.ppat.1003258. Epub 2013 May 16. PLoS Pathog. 2013. PMID: 23696729 Free PMC article. Review. No abstract available.
-
Exploitation of glycosylation in enveloped virus pathobiology.Biochim Biophys Acta Gen Subj. 2019 Oct;1863(10):1480-1497. doi: 10.1016/j.bbagen.2019.05.012. Epub 2019 May 20. Biochim Biophys Acta Gen Subj. 2019. PMID: 31121217 Free PMC article. Review.
References
-
- Harvey DJ. Mass Spectrom Rev. 1999;18:349. - PubMed
-
- Harvey DJ, Martin RL, Jackson KA, Sutton CW. Rapid Commun Mass Spectrom. 2004;18:2997. - PubMed
-
- Harvey DJ. J Am Soc Mass Spectrom. 2005;16:631. - PubMed
-
- Harvey DJ. J Am Soc Mass Spectrom. 2005;16:622. - PubMed
-
- Harvey DJ. J Am Soc Mass Spectrom. 2005;16:647. - PubMed
Publication types
MeSH terms
Substances
Grants and funding
LinkOut - more resources
Full Text Sources
Medical