

Indicators of buprenorphine and methadone use and abuse: what do we know?
- PMID: 20132124
- PMCID: PMC3723402
- DOI: 10.1111/j.1521-0391.2009.00008.x
Indicators of buprenorphine and methadone use and abuse: what do we know?
Abstract
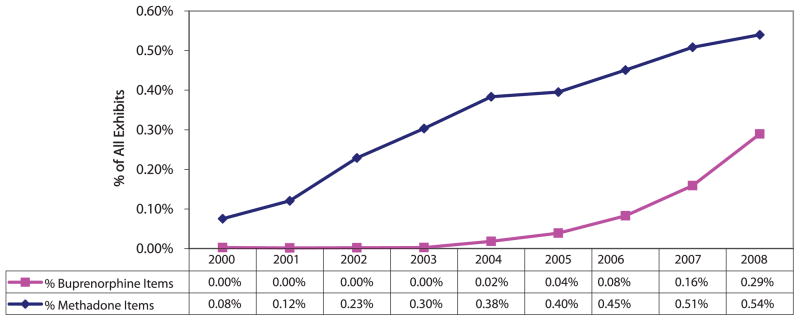
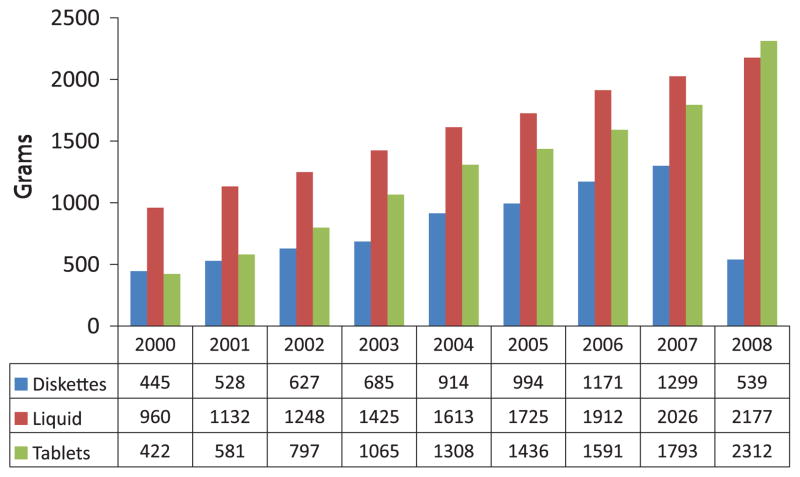
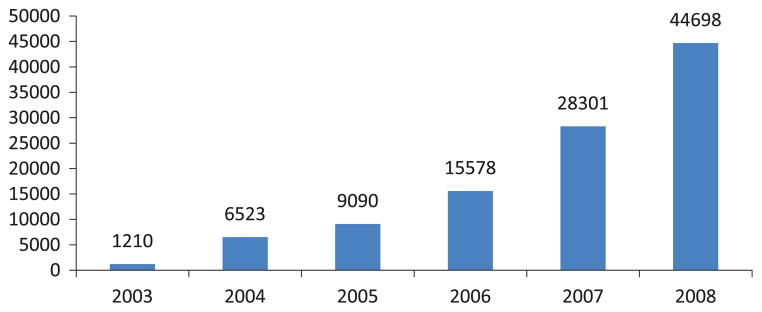
Abuse of prescription opioids is a growing problem. The number of methadone pain pills distributed now exceeds liquid methadone used in opioid treatment, and the increases in buprenorphine indicators provide evidence of the need to monitor and intervene to decrease the abuse of this drug. The need for additional and improved data to track trends is discussed, along with findings as to the characteristics of the users and combinations of drugs. Data on toxicities related to methadone or buprenorphine, particularly in combination with other prescribed drugs, are presented and clinical implications and considerations are offered. These findings underscore the need for physicians to be aware of potential toxicities and to educate their patients regarding these issues.
Conflict of interest statement
Declaration of Interest
The authors report no conflict of interest. The authors alone are responsible for the content and writing of the paper.
Figures
Similar articles
-
Drug interactions of clinical importance among the opioids, methadone and buprenorphine, and other frequently prescribed medications: a review.Am J Addict. 2010 Jan-Feb;19(1):4-16. doi: 10.1111/j.1521-0391.2009.00005.x. Am J Addict. 2010. PMID: 20132117 Free PMC article. Review.
-
Opioid-related mortality and filled prescriptions for buprenorphine and methadone.Drug Alcohol Rev. 2014 Sep;33(5):491-8. doi: 10.1111/dar.12143. Epub 2014 Apr 16. Drug Alcohol Rev. 2014. PMID: 24735085
-
Methadone and buprenorphine toxicity in children.Am J Addict. 2010 Jan-Feb;19(1):89-95. doi: 10.1111/j.1521-0391.2009.00002.x. Am J Addict. 2010. PMID: 20132125 Review.
-
Non-prescribed use of opioid substitution medication: Patterns and trends in sub-populations of opioid users in Germany.Int J Drug Policy. 2016 Mar;29:57-65. doi: 10.1016/j.drugpo.2015.12.024. Epub 2015 Dec 31. Int J Drug Policy. 2016. PMID: 26818083
-
Intravenous Misuse of Methadone, Buprenorphine and Buprenorphine-Naloxone in Patients Under Opioid Maintenance Treatment: A Cross-Sectional Multicentre Study.Eur Addict Res. 2019;25(1):10-19. doi: 10.1159/000496112. Epub 2019 Jan 9. Eur Addict Res. 2019. PMID: 30625491
Cited by
-
Buprenorphine maintenance therapy in opioid-addicted health care professionals returning to clinical practice: a hidden controversy.Mayo Clin Proc. 2012 Mar;87(3):260-7. doi: 10.1016/j.mayocp.2011.09.007. Mayo Clin Proc. 2012. PMID: 22386182 Free PMC article.
-
Pharmacokinetics of Sublingual Buprenorphine and Naloxone in Subjects with Mild to Severe Hepatic Impairment (Child-Pugh Classes A, B, and C), in Hepatitis C Virus-Seropositive Subjects, and in Healthy Volunteers.Clin Pharmacokinet. 2015 Aug;54(8):837-49. doi: 10.1007/s40262-015-0238-6. Clin Pharmacokinet. 2015. PMID: 25603822 Clinical Trial.
-
Illicit use of buprenorphine in a community sample of young adult non-medical users of pharmaceutical opioids.Drug Alcohol Depend. 2012 May 1;122(3):201-7. doi: 10.1016/j.drugalcdep.2011.09.029. Epub 2011 Oct 28. Drug Alcohol Depend. 2012. PMID: 22036303 Free PMC article.
-
Abuse liability of intravenous buprenorphine vs. buprenorphine/naloxone: Importance of absolute naloxone amount.Drug Alcohol Depend. 2017 Oct 1;179:362-369. doi: 10.1016/j.drugalcdep.2017.06.033. Epub 2017 Jul 26. Drug Alcohol Depend. 2017. PMID: 28844013 Free PMC article.
-
Treatment of Chronic Hepatitis C in Patients Receiving Opioid Agonist Therapy: A Review of Best Practice.Infect Dis Clin North Am. 2018 Jun;32(2):347-370. doi: 10.1016/j.idc.2018.02.001. Infect Dis Clin North Am. 2018. PMID: 29778260 Free PMC article. Review.
References
-
- Hall A, Logan J, Toblin R, et al. Patterns of abuse among unintentional pharmaceutical overdose fatalities. JAMA. 2008;300:2613–2620. - PubMed
-
- Paulozzi L, Budnitz D, Yongli X. Increasing deaths from opi-oid analgesics in the United States. Pharmacoepidemiol Drug Saf. 2006;15:618–627. - PubMed
-
- Fingerhut LA. Increases in methadone-related deaths: 1999–2004. National Center for Health Statistics; [Accessed March 19, 2009]. Available at: http://www2d.cdc.gov/ncidod/ts/print.asp.
-
- U.S. Department of Health and Human Services, Substance Abuse and Mental Health Services Administration, Office of Applied Studies. Special data runs, Excel-All_sup_1created on April 23, 2009.
-
- [Accessed March 31, 2009];International Statistical Classification of Diseases and Related Health Problems 10th Revision, Version for 2007. Available at: http://apps.who.int/classifications/apps/icd/icd10online/
Publication types
MeSH terms
Substances
Grants and funding
LinkOut - more resources
Full Text Sources
Medical
