

Differential genome-wide gene expression profiling of bovine largest and second-largest follicles: identification of genes associated with growth of dominant follicles
- PMID: 20132558
- PMCID: PMC2833166
- DOI: 10.1186/1477-7827-8-11
Differential genome-wide gene expression profiling of bovine largest and second-largest follicles: identification of genes associated with growth of dominant follicles
Abstract
Background: Bovine follicular development is regulated by numerous molecular mechanisms and biological pathways. In this study, we tried to identify differentially expressed genes between largest (F1) and second-largest follicles (F2), and classify them by global gene expression profiling using a combination of microarray and quantitative real-time PCR (QPCR) analysis. The follicular status of F1 and F2 were further evaluated in terms of healthy and atretic conditions by investigating mRNA localization of identified genes.
Methods: Global gene expression profiles of F1 (10.7 +/- 0.7 mm) and F2 (7.8 +/- 0.2 mm) were analyzed by hierarchical cluster analysis and expression profiles of 16 representative genes were confirmed by QPCR analysis. In addition, localization of six identified transcripts was investigated in healthy and atretic follicles using in situ hybridization. The healthy or atretic condition of examined follicles was classified by progesterone and estradiol concentrations in follicular fluid.
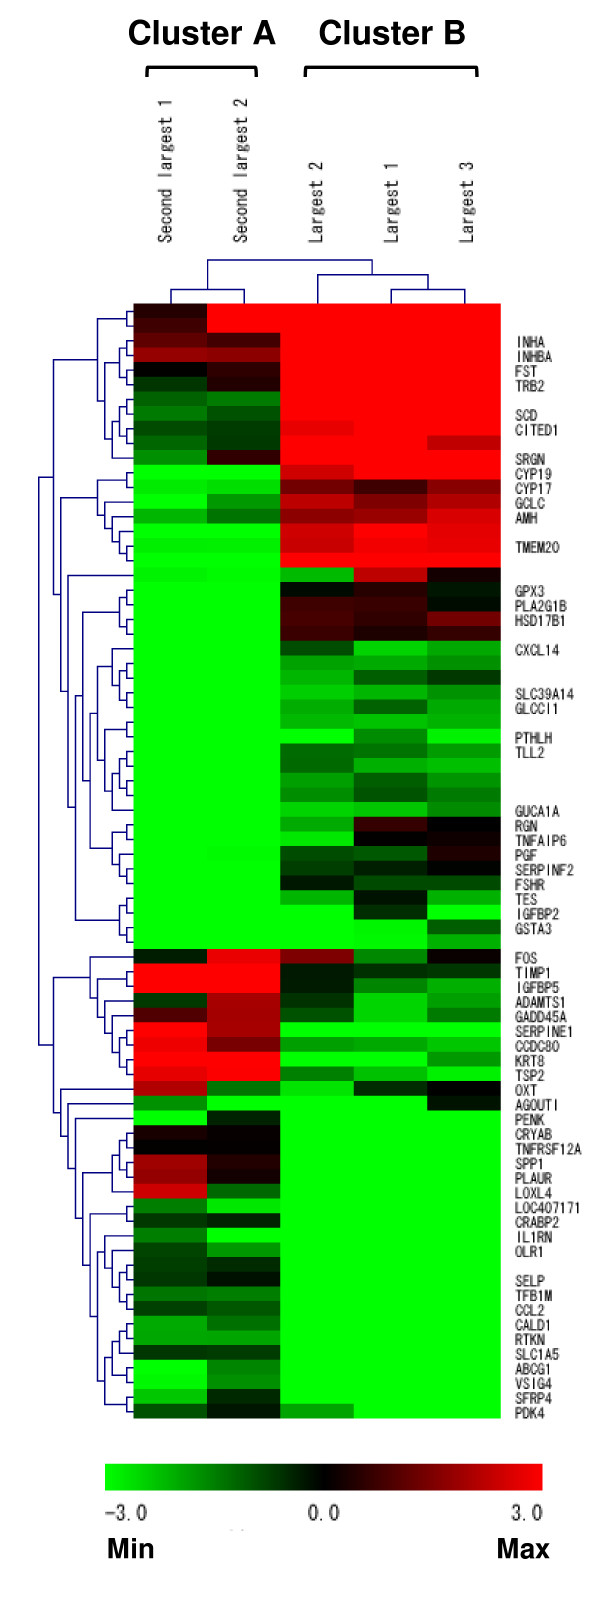
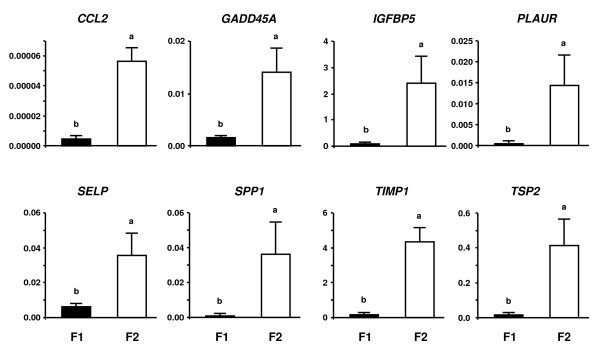
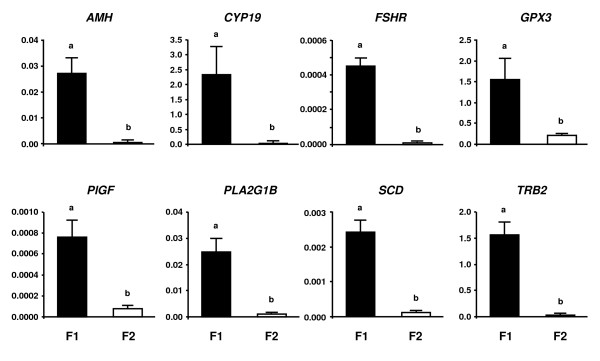
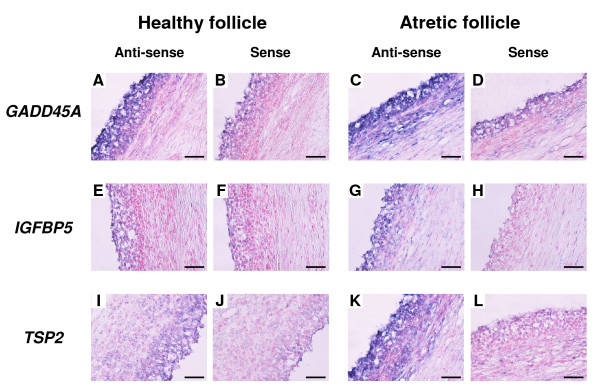
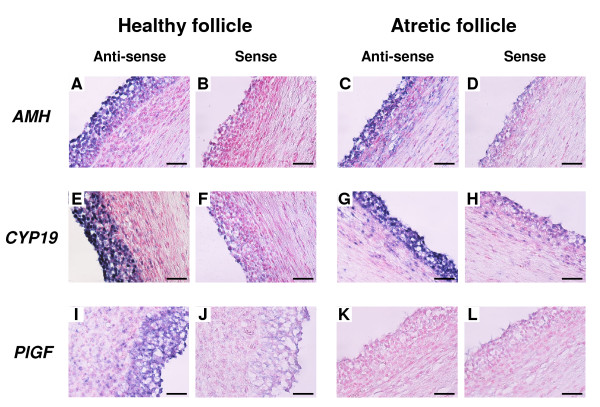
Results: Hierarchical cluster analysis of microarray data classified the follicles into two clusters. Cluster A was composed of only F2 and was characterized by high expression of 31 genes including IGFBP5, whereas cluster B contained only F1 and predominantly expressed 45 genes including CYP19 and FSHR. QPCR analysis confirmed AMH, CYP19, FSHR, GPX3, PlGF, PLA2G1B, SCD and TRB2 were greater in F1 than F2, while CCL2, GADD45A, IGFBP5, PLAUR, SELP, SPP1, TIMP1 and TSP2 were greater in F2 than in F1. In situ hybridization showed that AMH and CYP19 were detected in granulosa cells (GC) of healthy as well as atretic follicles. PlGF was localized in GC and in the theca layer (TL) of healthy follicles. IGFBP5 was detected in both GC and TL of atretic follicles. GADD45A and TSP2 were localized in both GC and TL of atretic follicles, whereas healthy follicles expressed them only in GC.
Conclusion: We demonstrated that global gene expression profiling of F1 and F2 clearly reflected a difference in their follicular status. Expression of stage-specific genes in follicles may be closely associated with their growth or atresia. Several genes identified in this study will provide intriguing candidates for the determination of follicular growth.
Figures
Similar articles
-
Transcriptome profiling of granulosa cells from bovine ovarian follicles during atresia.BMC Genomics. 2014 Jan 18;15:40. doi: 10.1186/1471-2164-15-40. BMC Genomics. 2014. PMID: 24438529 Free PMC article.
-
Differential gene expression of serine protease inhibitors in bovine ovarian follicle: possible involvement in follicular growth and atresia.Reprod Biol Endocrinol. 2011 May 27;9:72. doi: 10.1186/1477-7827-9-72. Reprod Biol Endocrinol. 2011. PMID: 21619581 Free PMC article.
-
Expression of messenger ribonucleic acid (mRNA) encoding 3beta-hydroxysteroid dehydrogenase delta4,delta5 isomerase (3beta-HSD) during recruitment and selection of bovine ovarian follicles: identification of dominant follicles by expression of 3beta-HSD mRNA within the granulosa cell layer.Biol Reprod. 1997 Jun;56(6):1466-73. doi: 10.1095/biolreprod56.6.1466. Biol Reprod. 1997. PMID: 9166699
-
Identification of genes involved in apoptosis and dominant follicle development during follicular waves in cattle.Biol Reprod. 2004 May;70(5):1475-84. doi: 10.1095/biolreprod.103.025114. Epub 2004 Jan 21. Biol Reprod. 2004. PMID: 14736815
-
Morphological classification of bovine ovarian follicles.Reproduction. 2010 Feb;139(2):309-18. doi: 10.1530/REP-09-0177. Epub 2009 Sep 28. Reproduction. 2010. PMID: 19786400 Review.
Cited by
-
Dietary Selenium Supplementation Ameliorates Female Reproductive Efficiency in Aging Mice.Antioxidants (Basel). 2019 Dec 11;8(12):634. doi: 10.3390/antiox8120634. Antioxidants (Basel). 2019. PMID: 31835711 Free PMC article.
-
Classification of Atretic Small Antral Follicles in the Human Ovary.Int J Mol Sci. 2023 Nov 28;24(23):16846. doi: 10.3390/ijms242316846. Int J Mol Sci. 2023. PMID: 38069168 Free PMC article.
-
Genome-Wide Association Study for Indicator Traits of Sexual Precocity in Nellore Cattle.PLoS One. 2016 Aug 5;11(8):e0159502. doi: 10.1371/journal.pone.0159502. eCollection 2016. PLoS One. 2016. PMID: 27494397 Free PMC article.
-
Joint MiRNA/mRNA expression profiling reveals changes consistent with development of dysfunctional corpus luteum after weight gain.PLoS One. 2015 Aug 10;10(8):e0135163. doi: 10.1371/journal.pone.0135163. eCollection 2015. PLoS One. 2015. PMID: 26258540 Free PMC article.
-
Transcriptome profiling of granulosa cells from bovine ovarian follicles during atresia.BMC Genomics. 2014 Jan 18;15:40. doi: 10.1186/1471-2164-15-40. BMC Genomics. 2014. PMID: 24438529 Free PMC article.
References
-
- Ginther OJ, Knopf L, Kastelic JP. Temporal associations among ovarian events in cattle during oestrous cycles with two and three follicular waves. J Reprod Fertil. 1989;87:223–230. - PubMed
-
- Sunderland SJ, Crowe MA, Boland MP, Roche JF, Ireland JJ. Selection, dominance and atresia of follicles during the oestrous cycle of heifers. J Reprod Fertil. 1994;101:547–555. - PubMed
Publication types
MeSH terms
LinkOut - more resources
Full Text Sources
Other Literature Sources
Molecular Biology Databases
Research Materials
Miscellaneous
