

Differential engagement of brain regions within a 'core' network during scene construction
- PMID: 20132831
- PMCID: PMC2850391
- DOI: 10.1016/j.neuropsychologia.2010.01.022
Differential engagement of brain regions within a 'core' network during scene construction
Abstract
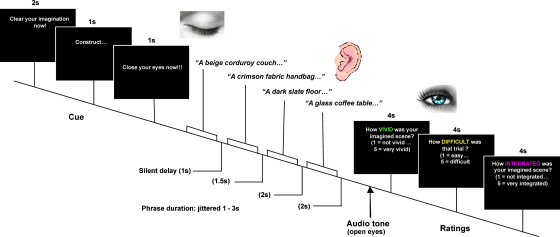
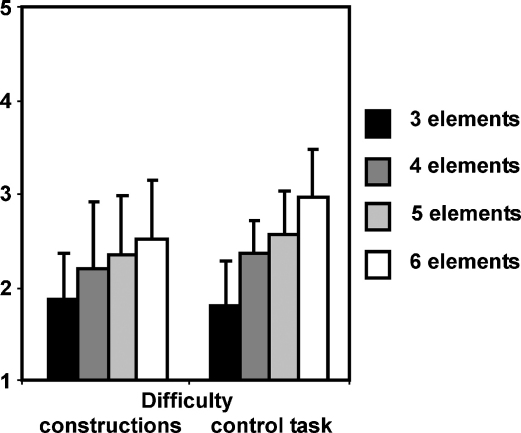
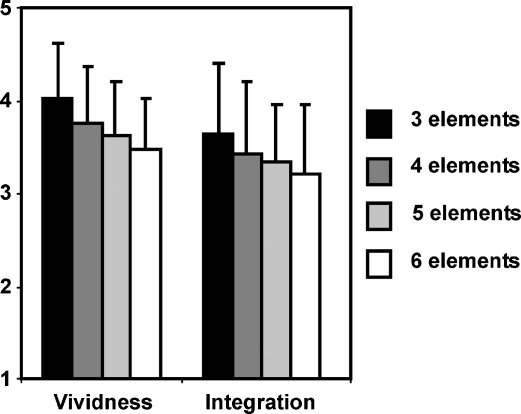
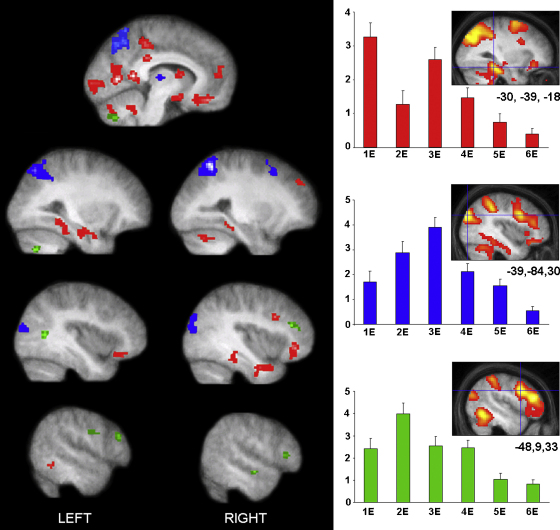
Reliving past events and imagining potential future events engages a well-established "core" network of brain areas. How the brain constructs, or reconstructs, these experiences or scenes has been debated extensively in the literature, but remains poorly understood. Here we designed a novel task to investigate this (re)constructive process by directly exploring how naturalistic scenes are built up from their individual elements. We "slowed-down" the construction process through the use of auditorily presented phrases describing single scene elements in a serial manner. Participants were required to integrate these elements (ranging from three to six in number) together in their imagination to form a naturalistic scene. We identified three distinct sub-networks of brain areas, each with different fMRI BOLD response profiles, favouring specific points in the scene construction process. Areas including the hippocampus and retrosplenial cortex had a biphasic profile, activating when a single scene element was imagined and when 3 elements were combined together; regions including the intra-parietal sulcus and angular gyrus steadily increased activity from 1 to 3 elements; while activity in areas such as lateral prefrontal cortex was observed from the second element onwards. Activity in these sub-networks did not increase further when integrating more than three elements. Participants confirmed that three elements were sufficient to construct a coherent and vivid scene, and once this was achieved, the addition of further elements only involved maintenance or small changes to that established scene. This task offers a potentially useful tool for breaking down scene construction, a process that may be key to a range of cognitive functions such as episodic memory, future thinking and navigation.
(c) 2010 Elsevier Ltd. All rights reserved.
Figures
Similar articles
-
Individual variation in the propensity for prospective thought is associated with functional integration between visual and retrosplenial cortex.Cortex. 2018 Feb;99:224-234. doi: 10.1016/j.cortex.2017.11.015. Epub 2017 Dec 5. Cortex. 2018. PMID: 29287243
-
Scene construction in developmental amnesia: an fMRI study.Neuropsychologia. 2014 Jan;52:1-10. doi: 10.1016/j.neuropsychologia.2013.11.001. Epub 2013 Nov 11. Neuropsychologia. 2014. PMID: 24231038 Free PMC article.
-
The Neural Dynamics of Novel Scene Imagery.J Neurosci. 2019 May 29;39(22):4375-4386. doi: 10.1523/JNEUROSCI.2497-18.2019. Epub 2019 Mar 22. J Neurosci. 2019. PMID: 30902867 Free PMC article.
-
Rethinking the Role of the Angular Gyrus in Remembering the Past and Imagining the Future: The Contextual Integration Model.Neuroscientist. 2018 Aug;24(4):342-352. doi: 10.1177/1073858417735514. Epub 2017 Oct 10. Neuroscientist. 2018. PMID: 29283042 Review.
-
Mapping of the neuronal networks of human cortical brain functions.Adv Tech Stand Neurosurg. 2003;28:91-142. doi: 10.1007/978-3-7091-0641-9_2. Adv Tech Stand Neurosurg. 2003. PMID: 12627809 Review.
Cited by
-
Real World Problem-Solving.Front Hum Neurosci. 2018 Jun 26;12:261. doi: 10.3389/fnhum.2018.00261. eCollection 2018. Front Hum Neurosci. 2018. PMID: 29997490 Free PMC article.
-
The influence of the precuneus on the medial temporal cortex determines the subjective quality of memory during the retrieval of naturalistic episodes.Sci Rep. 2024 Apr 4;14(1):7943. doi: 10.1038/s41598-024-58298-y. Sci Rep. 2024. PMID: 38575698 Free PMC article.
-
Patient HC with developmental amnesia can construct future scenarios.Neuropsychologia. 2011 Nov;49(13):3620-8. doi: 10.1016/j.neuropsychologia.2011.09.015. Epub 2011 Sep 22. Neuropsychologia. 2011. PMID: 21964201 Free PMC article.
-
The effect of hippocampal damage in children on recalling the past and imagining new experiences.Neuropsychologia. 2011 Jun;49(7):1843-50. doi: 10.1016/j.neuropsychologia.2011.03.008. Epub 2011 Mar 21. Neuropsychologia. 2011. PMID: 21414334 Free PMC article.
-
Fact vs fiction--how paratextual information shapes our reading processes.Soc Cogn Affect Neurosci. 2014 Jan;9(1):22-9. doi: 10.1093/scan/nss098. Epub 2012 Sep 5. Soc Cogn Affect Neurosci. 2014. PMID: 22956671 Free PMC article.
References
-
- Bar M. Visual objects in context. Nature Reviews Neuroscience. 2004;5:617–629. - PubMed
-
- Bar M., Aminoff E. Cortical analysis of visual context. Neuron. 2003;38:347–358. - PubMed
-
- Bartlett F.C. Cambridge University Press; 1932. Remembering.
-
- Bird C.M., Burgess N. The hippocampus and memory: Insights from spatial processing. Nature Reviews Neuroscience. 2008;9:182–194. - PubMed
Publication types
MeSH terms
Grants and funding
LinkOut - more resources
Full Text Sources
Miscellaneous
