. 2010 Apr;20(4):473-84.
doi: 10.1101/gr.103226.109. Epub 2010 Feb 4.

Positioned and G/C-capped poly(dA:dT) tracts associate with the centers of nucleosome-free regions in yeast promoters

Affiliations

Positioned and G/C-capped poly(dA:dT) tracts associate with the centers of nucleosome-free regions in yeast promoters

Randy Wu et al. Genome Res. 2010 Apr.

Abstract

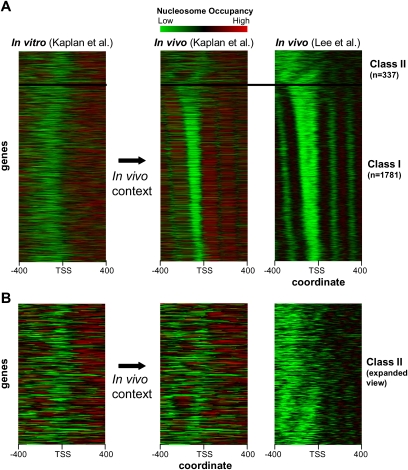
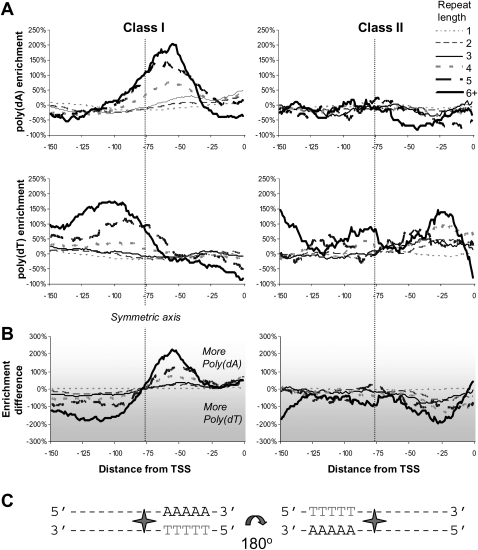
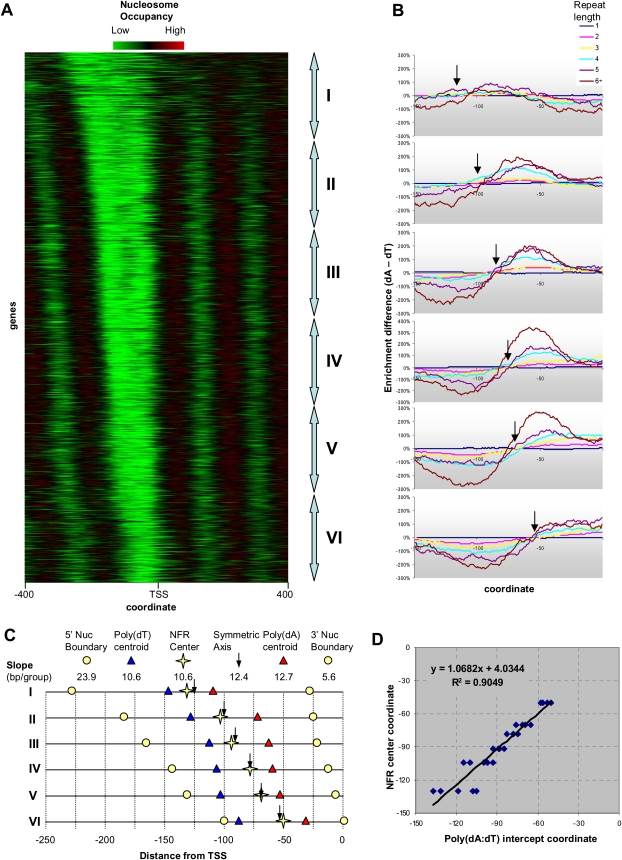
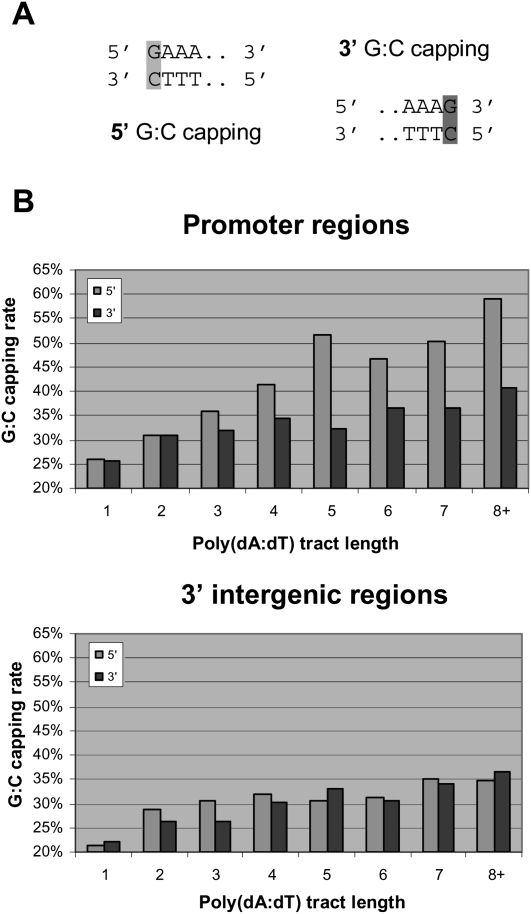
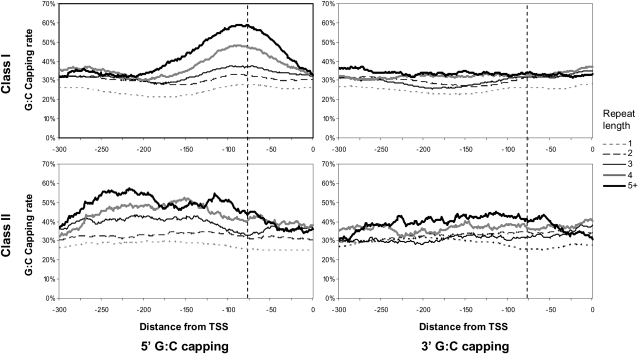
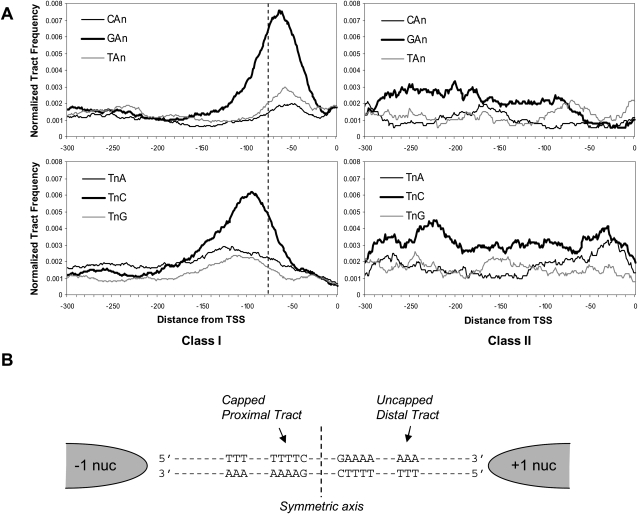
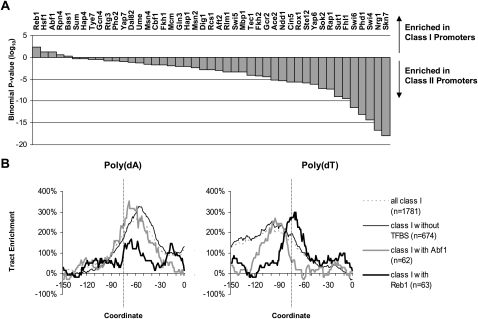
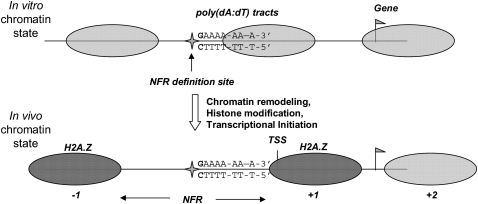
Eukaryotic transcriptional regulation is mediated by the organization of nucleosomes in promoter regions. Most Saccharomyces cerevisiae promoters have a highly stereotyped chromatin organization, where nucleosome-free regions (NFR) are flanked by well-ordered nucleosomes. We have found that yeast promoters fall into two classes differing in NFR sharpness, and that this distinction follows a known transcriptional dichotomy in yeast genes. A class of yeast promoters having well-defined NFRs are characterized by positioned patterns of poly(dA:dT) tracts with several novel features. First, poly(dA:dT) tracts are localized in a strand-dependent manner, with poly(dA) tracts lying proximal to transcriptional start sites and poly(dT) tracts lying distal, and collectively define a symmetry axis that is coincident with NFR centers. Second, poly(dA:dT) tracts are preferentially "capped" by G:C residues on the terminus proximal to the symmetry axis. Both signature features co-vary with fine positional variations between NFRs, establishing a closely knit relationship between poly(dA:dT) tracts, their capping patterns, and the central coordinates of NFRs. We found that these features are unique to promoters with well-defined NFRs, and that these promoters display significant difference between in vitro and in vivo nucleosome occupancy patterns. These observations are consistent with a model in which localized and G:C-capped poly(dA:dT) tracts initiate or facilitate the formation of NFRs at their center, possibly with chromatin remodeling and transcriptional machines involved.


Figures

Figure 1.
Figure 1.
Comparison of in vitro and in vivo nucleosome maps at yeast promoters. (A) Nucleosome maps from tiling array data (Lee et al. 2007) for 2118 S. cerevisiae promoters were clustered using a self-organizing map (SOM) and visually partitioned into two groups (class I and class II). In vivo and in vitro nucleosome maps (Kaplan et al. 2008) were ordered according to the SOM. Maps were aligned according to transcriptional start sites determined using tiling arrays (David et al. 2006). (B) Close-up of the class II promoter class.
Figure 2.
Figure 2.
Poly(dA:dT) tract enrichment patterns in yeast promoters. (A) Poly(dA:dT) tract frequencies in class I and class II promoters are represented as relative percent enrichments over background tract frequencies. Tracts in the two orientations are considered separately and referenced as either poly(dA) or poly(dT) according to the downstream direction of transcription. Data are smoothed over 21-bp windows. Tracts of lengths 6 and greater were considered collectively for statistical accuracy. Coordinates are relative to transcription start sites (TSS). (B) Enrichment differences between poly(dA) and poly(dT) tracts as a function of promoter position; values above the x-axis indicate greater poly(dA) enrichment. The symmetric axis near −75 is indicated with a dashed line. (C) Illustrating the 180° rotational (i.e., C2) symmetry of poly(dA:dT) tracts with respect to the symmetric axis.
Figure 3.
Figure 3.
Poly(dA:dT) tracts track fine variations in NFR positions. (A) The class I promoters, which show a progressive narrowing of the NFR, are divided into six equal subgroups, I–VI. (B) Poly(dA:dT) tract enrichment differences for each subgroup. Arrows denote locations of symmetric axes for individual subgroups. (C) Schematic summary of the locations of six promoter elements in each promoter subgroup. Slopes are derived by linear regression and represent the average number of base pairs an element shifts per subgroup of promoters. (D) Plot of NFR center coordinates versus poly(dA:dT) intercept coordinates. Multiple points for each subgroup represent intercepts for different tract length.
Figure 4.
Figure 4.
G:C capping of poly(dA:dT) tracts. (A) Illustrating the concept of poly(dA:dT) G:C capping. The poly(dA) strand preferentially terminates with G residues at both ends, while the poly(dT) strand preferentially terminates with C. The capping terminal is designated relative to the poly(dA) strand: GAn and TnC tracts, 5′ capping; AnG and CTn, 3′ capping. (B) G:C-capping rates at 5′ and 3′ termini over different tract lengths in promoter intergenic regions (from TSS to −150) and 3′ intergenic regions (nonoverlapping with promoter sequences).
Figure 5.
Figure 5.
5′ and 3′ G:C-capping rates, as functions from the TSS in class I and class II promoters. Patterns denote different poly(dA:dT) tract lengths; tracts 5 and longer were pooled for statistical accuracy. Vertical dashed line indicates the position of the symmetric axis for the average class I promoter.
Figure 6.
Figure 6.
5′ G:C capping splits poly(dA:dT) tracts into subpopulations proximal and distal to the symmetric axis. (A) Frequencies of poly(dA:dT) tracts (n = 4) with different 5′ capping bases were computed in class I and class II promoters. Frequencies represented on the vertical axis are numbers of motifs per promoter per base smoothed across a 21-bp window. Bold black curves represent 5′ G:C capping. (B) Schematic representation of the data from (A) showing a hypothetical class I promoter with 5′ G:C-capped and -uncapped poly(dA:dT) tracts arranged across the symmetric axis.
Figure 7.
Figure 7.
Poly(dA:dT) enrichments occur independently of transcription factor binding sites. (A) Ranking of transcription factors by overrepresentation of bound and functionally conserved sites in class I promoters based on annotated sites from MacIssac et al. (2006). P-values were computed by modeling the distribution of TFBS between class I and class II promoters using a binomial distribution. The vertical axis gives the logarithm of the cumulative binomial probably of having the observed number of TFBS in a given class. Overrepresentation in class I promoters is shown by positive values and in class II promoters by negative values. (B) Poly(dA:dT) tract enrichments (length ≥ 4) for class I promoters and subsets thereof: Abf1-containing promoters, Reb1-containing promoters, and TFBS-depleted promoters. TFBS-depleted promoters were selected by excluding promoters containing moderately bound (P < 0.005) binding sites (no conservation requirement) for any of 118 TFs.
Figure 8.
Figure 8.
A model of how poly(dA:dT) tracts mediate extrinsic nucleosome-positioning effects. Illustrating a hypothetical role of poly(dA:dT) tracts in facilitating a the formation of an in vivo NFR during nucleosome assembly or remodeling. 5′ G:C-capped poly(dA:dT) tracts, in conjunction with downstream uncapped tracts, may guide the activity of a chromatin-remodeling complex or transcription factor. The 5′ capping residue may signal the initiation or termination of remodeling activity. This process may be coupled to the deposition of histone H2A.Z deposition into boundary nucleosomes. The NFR, once established, serves as the basis for subsequent transcriptional initiation events.

Similar articles

Cited by

References

    1. Albert I, Mavrich TN, Tomsho LP, Qi J, Zanton SJ, Schuster SC, Pugh BF. Translational and rotational settings of H2A.Z nucleosomes across the Saccharomyces cerevisiae genome. Nature. 2007;446:572–576. - PubMed
    1. Anderson JD, Widom J. Poly(dA-dT) promoter elements increase the equilibrium accessibility of nucleosomal DNA target sites. Mol Cell Biol. 2001;21:3830–3839. - PMC - PubMed
    1. Bao Y, White CL, Luger K. Nucleosome core particles containing a poly(dA·dT) sequence element exhibit a locally distorted DNA structure. J Mol Biol. 2006;361:617–624. - PubMed
    1. Basehoar AD, Zanton SJ, Pugh BF. Identification and distinct regulation of yeast TATA box-containing genes. Cell. 2004;116:699–709. - PubMed
    1. Behe MJ. An overabundance of long oligopurine tracts occurs in the genome of simple and complex eukaryotes. Nucleic Acids Res. 1995;23:689–695. - PMC - PubMed

LinkOut - more resources