Comparative Study
. 2010 Apr;20(4):519-25.
doi: 10.1101/gr.102129.109. Epub 2010 Feb 4.

Digital transcriptome profiling from attomole-level RNA samples

Affiliations
Comparative Study

Digital transcriptome profiling from attomole-level RNA samples

Fatih Ozsolak et al. Genome Res. 2010 Apr.

Abstract

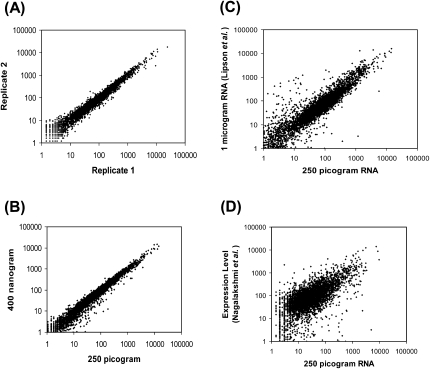
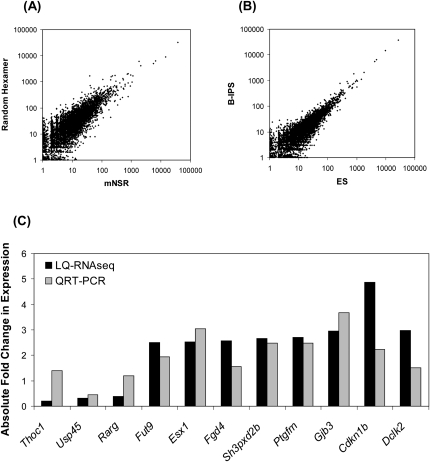
Accurate profiling of minute quantities of RNA in a global manner can enable key advances in many scientific and clinical disciplines. Here, we present low-quantity RNA sequencing (LQ-RNAseq), a high-throughput sequencing-based technique allowing whole transcriptome surveys from subnanogram RNA quantities in an amplification/ligation-free manner. LQ-RNAseq involves first-strand cDNA synthesis from RNA templates, followed by 3' polyA tailing of the single-stranded cDNA products and direct single molecule sequencing. We applied LQ-RNAseq to profile S. cerevisiae polyA+ transcripts, demonstrate the reproducibility of the approach across different sample preparations and independent instrument runs, and establish the absolute quantitative power of this method through comparisons with other reported transcript profiling techniques and through utilization of RNA spike-in experiments. We demonstrate the practical application of this approach to define the transcriptional landscape of mouse embryonic and induced pluripotent stem cells, observing transcriptional differences, including over 100 genes exhibiting differential expression between these otherwise very similar stem cell populations. This amplification-independent technology, which utilizes small quantities of nucleic acid and provides quantitative measurements of cellular transcripts, enables global gene expression measurements from minute amounts of materials and offers broad utility in both basic research and translational biology for characterization of rare cells.


Figures

Figure 1.
Figure 1.
Attomole-level LQ-RNAseq methodology. Picogram-level RNA is reverse-transcribed with random primers and treated with RNase. Purified single-stranded first-strand cDNA is poly-A-tailed and 3′ blocked with terminal transferase. The poly-A-tailed cDNA is sequenced with the Helicos Genetic Analysis System.
Figure 2.
Figure 2.
Reproducibility and quantitative ability of LQ-RNAseq. Reproducibility of S. cerevisiae polyA+ RNA (strain DBY746) expression profiles generated in two independent preparations of 250 pg of RNA run on different sequencers (A) and between 250-pg and 400-ng RNA preparations (B). (C,D) Comparison of LQ-RNAseq methodology to the published expression profile generated by oligo(dT) priming of 1 μg of polyA+ RNA from the same yeast strain used in this study (Lipson et al. 2009) (r = 0.915), and by random hexamer priming of 200 ng of RNA from another yeast strain (BY4741), adaptor ligation, and PCR amplification (Nagalakshmi et al. 2008) (r = 0.661). Log10 abundance is expressed using the number of unique reads aligned to each transcript in each sequencing experiment and expressed as reads number per kilobase per 1 million reads.
Figure 3.
Figure 3.
Coverage of reads aligned in the + direction (A) and − direction (B) binned in 10-nt intervals is exemplified across the HTA1 gene (location: chr4 915,521–915,919; transcription direction: +). (C) Assignment of uniquely aligned S. cerevisiae polyA+ RNA reads to the categories shown. TSS (transcription start site) category refers to regions 200 nt upstream of annotated coding region start sites; 7.4% of reads map to the yeast TSS regions. Reads in the S. cerevisiae intergenic regions include reads aligning mostly to the potentially transcriptionally active transposon repeats. (D) Assignment of uniquely aligned human liver polyA+ RNA reads to the categories shown. TSS category refers to regions 200 nt upstream and downstream of the annotated RefSeq transcription start sites; 0.2% of the reads map to the human TSS regions. (E) Human liver polyA+ RNA reads uniquely aligning to human genome was binned at 50-nt intervals and visualized using the Integrated Genome Browser. Panel exemplifies the distribution of reads across the human CDO1 (location: chr5 115,168,329–115,180,304; transcription direction: −) gene's exonic (thick bars) and intronic (thin lines) regions. Y-axis indicates the number of reads per bin.
Figure 4.
Figure 4.
Transcriptome profiling of B-iPS and ES cells. (A) Random hexamer and mNSR primer approaches using B-iPS RNA yield similar gene expression profiles. (B) Induced pluripotent stem cells derived from B lymphocytes exhibit expression profiles similar to embryonic stem cells. Log10 abundance is expressed using the number of unique reads aligned to each transcript in each sequencing experiment and is expressed as reads number per kilobase per 1 million reads. (C) Validation of differentially expressed genes identified by LQ-RNAseq with the qRT-PCR assay. (Black bars) Fold differences observed with LQ-RNAseq; (gray bars) fold differences observed with qRT-PCR. The two genes (Thoc1 and Rarg) exhibiting discrepant expression level changes may be due to the difference in the way expression levels are calculated with the two assays and the potential presence of alternative transcript isoforms.

References

    1. Armour CD, Castle JC, Chen R, Babak T, Loerch P, Jackson S, Shah JK, Dey J, Rohl CA, Johnson JM, et al. Digital transcriptome profiling using selective hexamer priming for cDNA synthesis. Nat Methods. 2009;6:647–649. - PubMed
    1. Che S, Ginsberg SD. Amplification of RNA transcripts using terminal continuation. Lab Invest. 2004;84:131–137. - PubMed
    1. Chin MH, Mason MJ, Xie W, Volinia S, Singer M, Peterson C, Ambartsumyan G, Aimiuwu O, Richter L, Zhang J, et al. Induced pluripotent stem cells and embryonic stem cells are distinguished by gene expression signatures. Cell Stem Cell. 2009;5:111–123. - PMC - PubMed
    1. Cloonan N, Forrest AR, Kolle G, Gardiner BB, Faulkner GJ, Brown MK, Taylor DF, Steptoe AL, Wani S, Bethel G, et al. Stem cell transcriptome profiling via massive-scale mRNA sequencing. Nat Methods. 2008;5:613–619. - PubMed
    1. Dean FB, Hosono S, Fang L, Wu X, Faruqi AF, Bray-Ward P, Sun Z, Zong Q, Du Y, Du J, et al. Comprehensive human genome amplification using multiple displacement amplification. Proc Natl Acad Sci. 2002;99:5261–5266. - PMC - PubMed

Publication types

MeSH terms

LinkOut - more resources