. 2010 Mar;20(3):320-31.
doi: 10.1101/gr.101907.109. Epub 2010 Feb 4.

Dynamic changes in the human methylome during differentiation

Affiliations

Dynamic changes in the human methylome during differentiation

Louise Laurent et al. Genome Res. 2010 Mar.

Abstract

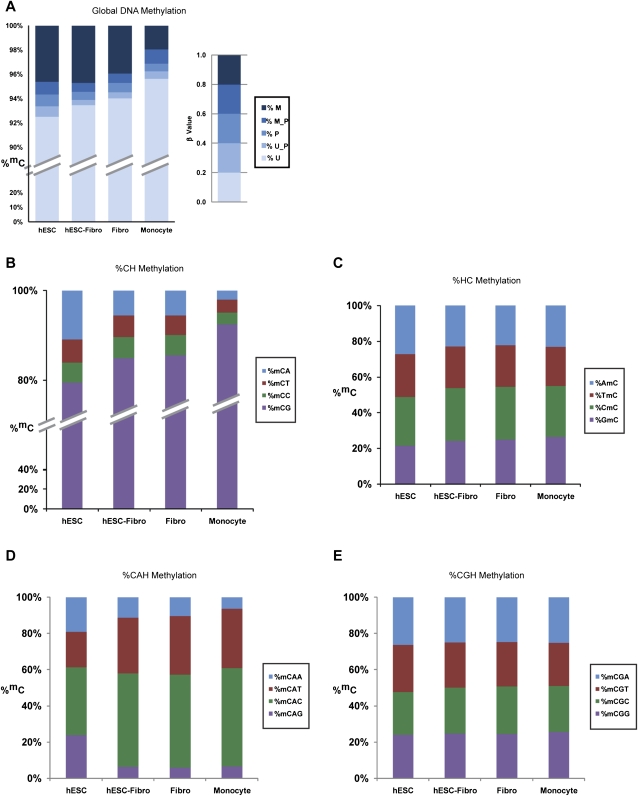
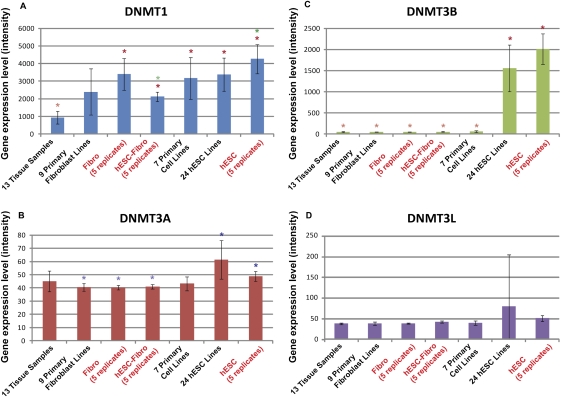
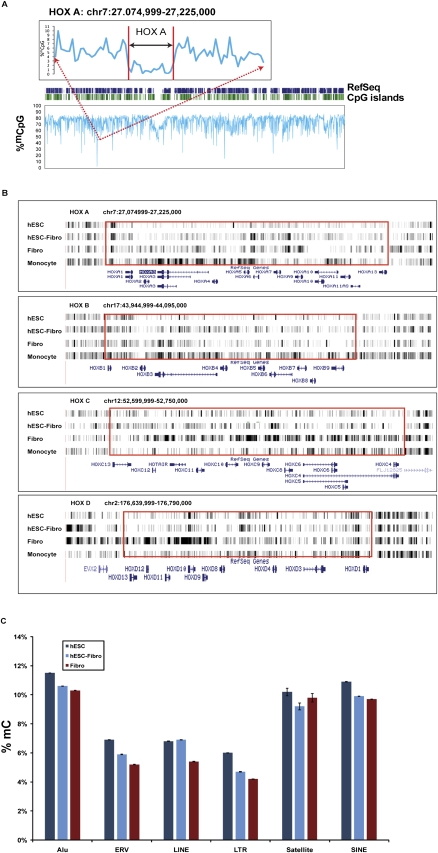
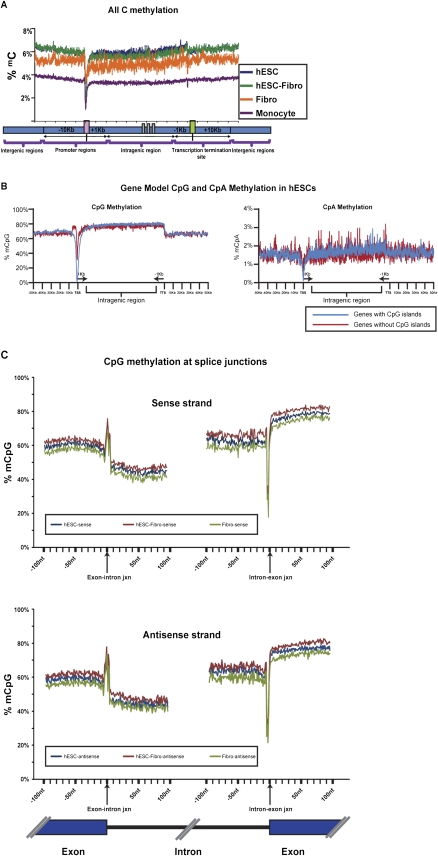
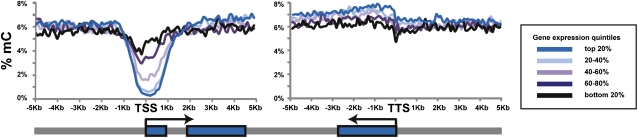
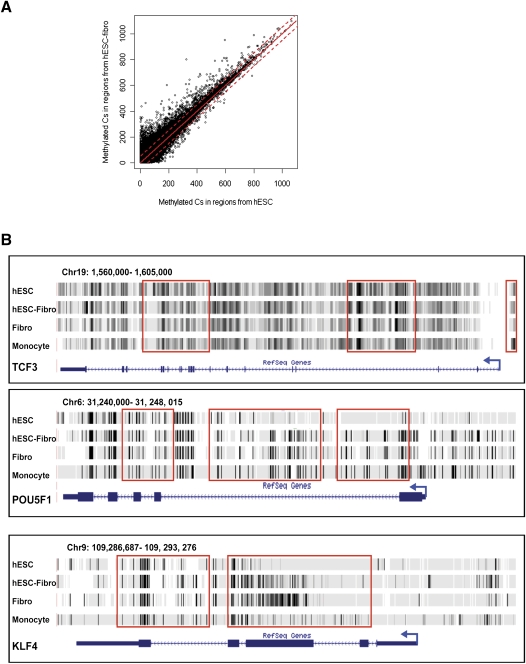
DNA methylation is a critical epigenetic regulator in mammalian development. Here, we present a whole-genome comparative view of DNA methylation using bisulfite sequencing of three cultured cell types representing progressive stages of differentiation: human embryonic stem cells (hESCs), a fibroblastic differentiated derivative of the hESCs, and neonatal fibroblasts. As a reference, we compared our maps with a methylome map of a fully differentiated adult cell type, mature peripheral blood mononuclear cells (monocytes). We observed many notable common and cell-type-specific features among all cell types. Promoter hypomethylation (both CG and CA) and higher levels of gene body methylation were positively correlated with transcription in all cell types. Exons were more highly methylated than introns, and sharp transitions of methylation occurred at exon-intron boundaries, suggesting a role for differential methylation in transcript splicing. Developmental stage was reflected in both the level of global methylation and extent of non-CpG methylation, with hESC highest, fibroblasts intermediate, and monocytes lowest. Differentiation-associated differential methylation profiles were observed for developmentally regulated genes, including the HOX clusters, other homeobox transcription factors, and pluripotence-associated genes such as POU5F1, TCF3, and KLF4. Our results highlight the value of high-resolution methylation maps, in conjunction with other systems-level analyses, for investigation of previously undetectable developmental regulatory mechanisms.


Figures

Figure 1.
Figure 1.
Distribution of DNA methylation levels and the corresponding sequence context. (A) The percentage of methylated Cs was determined by taking the ratio of the number of methylated Cs over the total number of covered Cs. Methylation levels were grouped into five categories: unmethylated (U), intermediate between unmethylated and partially methylated (U_P), partially methylated (P), intermediate between partially methylated and methylated (M_P), and methylated (M). Levels of methylation were found to be highest in undifferentiated hESCs at ∼6% with a reduction in the differentiated cells. The fully differentiated peripheral blood mononuclear cells (monocytes) had the lowest methylation levels at ∼3%. Note: the monocyte data were provided as a base-level methylome map for comparison purposes only (Jun Wang, Beijing Genome Institute). (B) DNA methylation in various combinations of sequence contexts (CH, HC, CHH; H = any four nucleotides) throughout the genome was examined. In the CH sequence context, CpG methylation was the predominant form, but a significant fraction of methylated cytosines were found at CpA sites, particularly in hESCs (where CpA methylation represented >10% of methylcytosines). Levels of CpA methylation were lower in differentiated cells (with the lowest levels in monocytes, 2% of methylcytosines found at CpA sites). (C) In the HC sequence context, the position immediately 5′ of the methylcytosine did not appear to influence the methylation rate, as levels of methylation of the four categories of HC were equally distributed. (D,E) In the CHH sequence context, the predominant methylation type was CGH, followed by CAH. The position immediately 3′ to the dinucleotide had a weak effect on the methylation and was largely dependent on the identity of the second base of the dinucleotide.
Figure 2.
Figure 2.
DNMT1, DNMT3A, DNMT3B, and DNMT3L gene expression in the hESC, hESC-Fibro, and Fibro cell types in the context of a large collection of tissue, primary cell, and hESC cell samples. Gene expression was extracted from microarray data (Muller et al. 2008). Gene expression levels measured as quantiles-normalized signal intensity are indicated on the y-axis. Error bars, SD. Data from five biological replicates of the cell lines used for bisulfite sequencing (hESC, hESC-Fibro, and Fibro) have red labels. Significant differences in expression between cell types are indicated by sets of colored asterisks; the cell types with higher expression are marked with darker asterisks, and the cell types with lower expression are marked with lighter asterisks of the same color (e.g., in A, DNMT1 expression is significantly lower in the Tissue group compared to all of the other groups with the exception of the Primary Fibroblast group).
Figure 3.
Figure 3.
(A) Methylation profile of chromosome 7 in hESC sample. (Dark blue bars) The positions of RefSeq genes; (green bars) the positions of CpG islands; (light blue trace) CpG methylation. The region surrounding the HOXA locus is expanded to show the level of hypomethylation. (B) The differential methylation profiles in relation to differentiation within the clusters of four HOX loci. Overall DNA methylation intensity of these clusters was the lowest in hESC and highest in monocytes and Fibro cells. (C) Percent total cytosine methylation for genomic repeat elements. Error bars, SD. The types of repeat elements shown are Alu, ERV, LINE, LTR, microsatellite, and SINE. Comparison of methylation levels of hESC, hESC-Fibro, and Fibro cell lines shows lower methylation in more differentiated cells for all of these types of repeat elements except microsatellites.
Figure 4.
Figure 4.
(A) Average distribution of DNA methylation mapped onto a gene model. Overall methylation levels at the TSS (transcription start site) region were lower in hESCs compared to the differentiated cell types. (B) The CpG and CpA methylation distribution surrounding genes with and without CpG islands (CpI), shown for hESCs. CpG and CpA methylation levels were lower at the TSS region in both genes with and genes without CpG islands at the promoter. However, the level of methylation was lower for genes with promoters containing CpG islands. Promoters without CpG islands showed a peak of CpG methylation ∼1.5–5.0 kb upstream of the TSS. Data for all cell types are shown in Supplemental Figure 7. (C) CpG methylation across splice junctions. The percent of mCpG across a 100-bp window spanning the exon/intron junctions was mapped. Both sense (upper panel) and antisense (lower panel) strands showed a sharp spike in CpG methylation at the exon/intron junction, followed by a steep decrease in methylation that gradually increases with proximity to the next exon. Another sharp spike, of decreased methylation in this case, is followed by a steep rise in methylation as the next exon begins.
Figure 5.
Figure 5.
Correlation of methylation profile with expression level in hESCs. The expression levels of genes in hESCs (from microarray analysis) were divided into five categories. The 20% most highly expressed genes exhibited the lowest methylation levels with the nadir of the hypomethylated “valley” centered at ±1 kb from their TSS. As the gene expression decreased, the valley became more shallow. Interestingly, the levels of methylation found in the gene bodies of the most highly expressed genes were slightly higher than in genes expressed at lower levels.
Figure 6.
Figure 6.
Differentially methylated regions (DMRs) in hESCs and hESC-Fibros. (A) Scatterplot of methylation level in hESCs (x-axis) versus in hESC-Fibro (y-axis). The red line indicates the cutoff of 5 SDs. The distribution is very similar in the two cell types, with a correlation coefficient of 0.879. (B) Examples of DMRs found in the pluripotence-associated transcription factors TCF3, POU5F1, and KLF4.

Similar articles

Cited by

References

    1. Ball MP, Li JB, Gao Y, Lee JH, LeProust EM, Park IH, Xie B, Daley GQ, Church GM. Targeted and genome-scale strategies reveal gene-body methylation signatures in human cells. Nat Biotechnol. 2009;27:361–368. - PMC - PubMed
    1. Batsche E, Yaniv M, Muchardt C. The human SWI/SNF subunit Brm is a regulator of alternative splicing. Nat Struct Mol Biol. 2006;13:22–29. - PubMed
    1. Bernstein BE, Mikkelsen TS, Xie X, Kamal M, Huebert DJ, Cuff J, Fry B, Meissner A, Wernig M, Plath K, et al. A bivalent chromatin structure marks key developmental genes in embryonic stem cells. Cell. 2006;125:315–326. - PubMed
    1. Bibikova M, Chudin E, Wu B, Zhou L, Garcia EW, Liu Y, Shin S, Plaia TW, Auerbach JM, Arking DE, et al. Human embryonic stem cells have a unique epigenetic signature. Genome Res. 2006;16:1075–1083. - PMC - PubMed
    1. Bird A, Taggart M, Frommer M, Miller OJ, Macleod D. A fraction of the mouse genome that is derived from islands of nonmethylated, CpG-rich DNA. Cell. 1985;40:91–99. - PubMed

Publication types

Associated data