

doi: 10.1126/science.1184208.
Epub 2010 Feb 4.
Regulation of alternative splicing by histone modifications
Affiliations
- PMID: 20133523
- PMCID: PMC2913848
- DOI: 10.1126/science.1184208
Item in Clipboard
Regulation of alternative splicing by histone modifications
Science.
.
Abstract
Alternative splicing of pre-mRNA is a prominent mechanism to generate protein diversity, yet its regulation is poorly understood. We demonstrated a direct role for histone modifications in alternative splicing. We found distinctive histone modification signatures that correlate with the splicing outcome in a set of human genes, and modulation of histone modifications causes splice site switching. Histone marks affect splicing outcome by influencing the recruitment of splicing regulators via a chromatin-binding protein. These results outline an adaptor system for the reading of histone marks by the pre-mRNA splicing machinery.
Figures
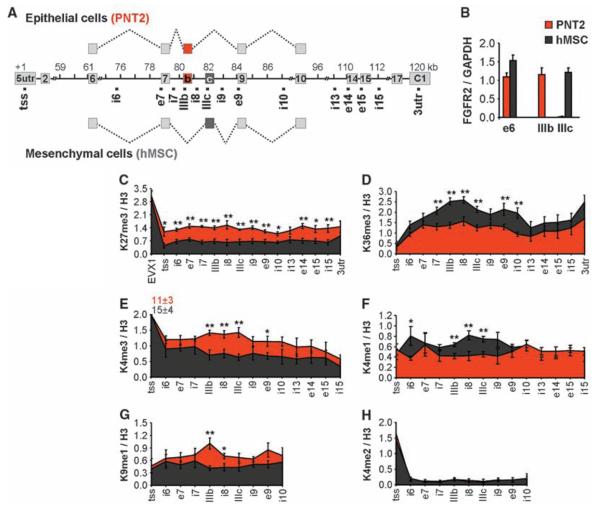
Splicing-specific histone modifications. (A) Schematic
representation of the human FGFR2 gene. Exon IIIb (red) is
included in PNT2 epithelial cells, exon IIIc (black) is included in hMSCs.
Square dots indicate oligonucleotide pairs used in analysis.
(B) Levels of FGFR2 exon inclusion relative to GAPDH in PNT2
(red) or hMSCs (black) determined by quantitative polymerase chain reaction
(PCR). (C to H) Mapping of H3-K27me3 (C),
H3-K36me3 (D), H3-K4me3 (E), H3-K4me1 (F), H3-K9me1 (G), and H3-K4me2 (H) in
FGFR2 in PNT2 (red) and hMSC (black) cells by
quantitative chromatin immunoprecipitation. The percentage of input was
normalized to unmodified H3. Values represent means ± SEM from four
to six independent experiments. *P < 0.05,
**P <0.01, Student's t
test.
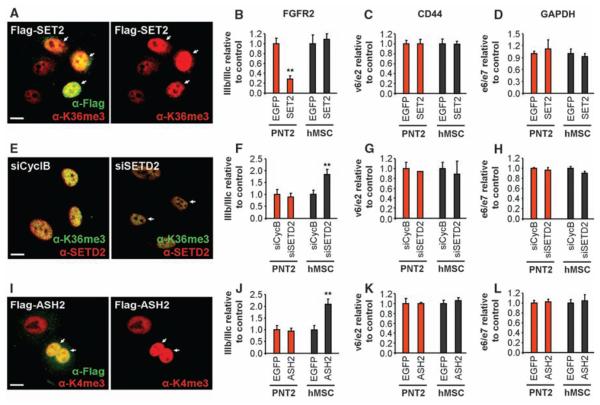
Modulation of alternative splicing by his-tone modifications. (A,
E, and I) H3-K36me3 levels after SET2/SETD2
modulation [(A) and (E)] and H3-K4me3 after ASH2 overexpression (I). Arrows
indicate transfected cells. Scale bar, 10 mm. (B to D,
F to H, and J to L)
Quantitative reverse transcription PCR (RT-PCR) analysis of exon ratios
after overexpression of Flag-SET2 [(B) to (D), SET2], down-regulation of
SETD2 [(F) to (H), siSETD2], or over-expression of Flag-ASH2 [(J) to (L),
ASH2] in PNT2 (red) or hMSC cells (black). Ratios are as follows: exon
IIIb/IIIc for FGFR2, exon v6/e2 for CD44, and exon e6/e7 for GAPDH. Values
represent means T SEM of percentages relative to EGFP or siCyclophilin B
used as controls from four to six independent experiments.
**P <0.01, Student's t test
compared to control.
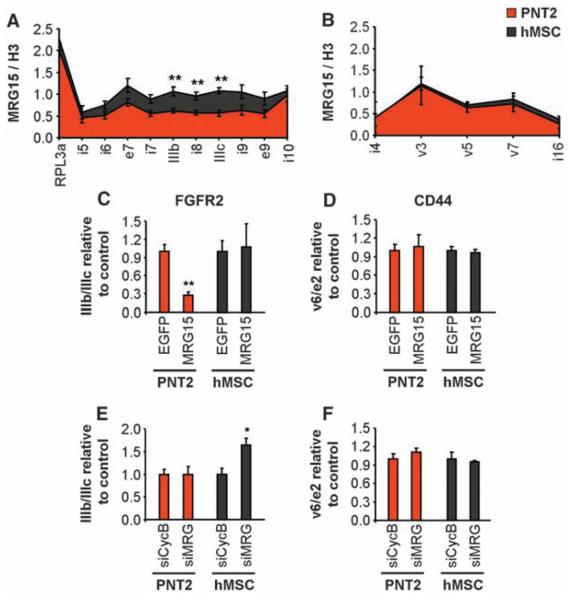
MRG15 modulates alternative splicing. (A and B)
Chromatin immunoprecipitation of MRG15 along FGFR2 (A) and CD44 (B) in PNT2
(red) and hMSC (black) cells. Input was normalized to unmodified H3. The
RPL13a promoter was a positive control. Values represent means ± SEM
from three to six independent experiments. (C to
F) Quantitative RT-PCR analysis of exon ratios after
overexpression of EGFP-MRG15 [(C) and (D), MRG15] or down-regulation of both
MRG15 and MRGX [(E) and (F), siMRG] in PNT2 (red) or hMSC (black) cells.
Ratios are as follows: exon IIIb/IIIc for FGFR2 and exon v6/e2 for CD44.
Values represent means ± SEM of percentages relative to EGFP or
siCyclophilin B used as controls from five independent experiments.
*P<0.05, **P<0.01,
Student's t test compared to control.
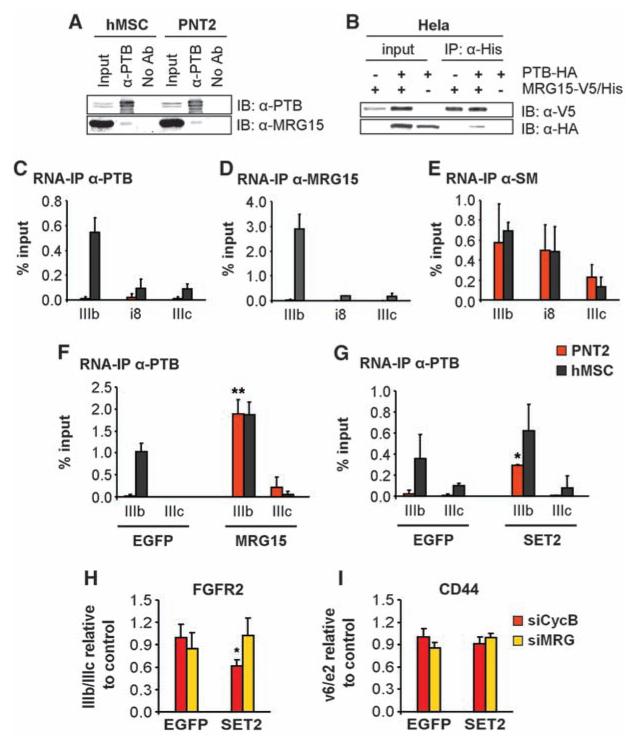
H3-K36me3 recruits PTB to exon IIIb via MRG15. (A) Immunoblot
detection of PTB and MRG15 after immuno-precipitation of PTB.
(B) Reciprocal coimmunoprecipitation of over-expressed
MRG15-V5/His and PTB-HA in Hela cells. (C to E)
RNA immunoprecipitation of PTB, MRG15, or Sm proteins in FGFR2 exons IIIb
and IIIc in PNT2 (red) or hMSC (black) cells. Values represent means
± SEM from three independent experiments. (F and
G) Overexpression of MRG15 (F) or SET2 (G) in PNT2 (red) or
hMSC (black) cells for 48 hours before RNA immunoprecipitation of PTB.
Values represent means ± SEM from three independent experiments.
(H and I) Quantitative RT-PCR analysis of exon
ratios in PNT2 cells depleted of MRG15 and MRGX (siMRG, yellow) or
cyclophilin B (siCycB, red) after overexpression of SET2 or EGFP. Ratios are
as follows: exon IIIb/IIIc for FGFR2 (H) and exon v6/e2 for CD44 (I). Values
represent means T SEM from five independent experiments. *P
< 0.05, **P < 0.01, Student's
t test compared to control.
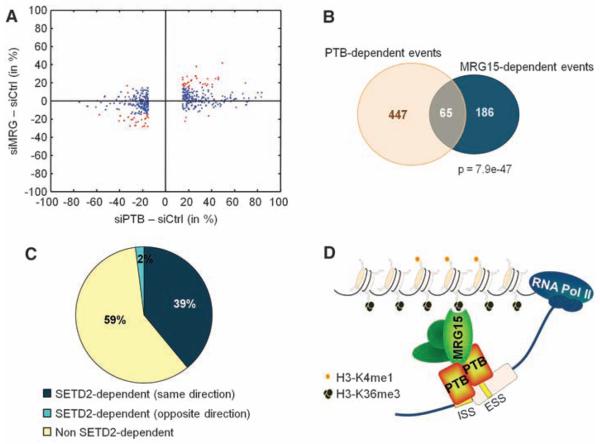
Genome-wide identification of SETD2, MRG15, and PTB alternative splicing
events in hMSC cells. (A) Scatterplot of AS events in MRG15-
(siMRG) or PTB-depleted cells (siPTB) as compared to small interfering RNA
control (siCtrl) transfected cells. The cutoff is ≥15% change in exon
usage. Red indicates codependent splicing events. (B) Venn
diagram of PTB- and MRG15-dependent events with ≥15% change in exon
usage. (C) Percentage of MRG15/PTB codependent events that are
also sensitive to SETD2 down-regulation. (D) An adaptor system
for reading histone marks by the splicing machinery, consisting of a histone
mark signature, a chromatin-binding protein (MRG15), and a splicing
regulator (PTB).
Comment in
-
Chromatin: the final frontier in splicing regulation?Dev Cell. 2010 Mar 16;18(3):336-8. doi: 10.1016/j.devcel.2010.03.002. Dev Cell. 2010. PMID: 20230741 Free PMC article.
-
Journal club. A human geneticist explores the ways that genes are regulated.Nature. 2010 Jul 1;466(7302):11. doi: 10.1038/466011e. Nature. 2010. PMID: 20595974 No abstract available.
References
Publication types
MeSH terms
Substances
Associated data
- Actions
Grants and funding
LinkOut - more resources
Full Text Sources
Other Literature Sources
Molecular Biology Databases
Research Materials
Miscellaneous
