. 2010 Feb 23;107(8):3528-33.
doi: 10.1073/pnas.0911027107. Epub 2010 Feb 2.

Spontaneous assembly and active disassembly balance adherens junction homeostasis

Affiliations

Spontaneous assembly and active disassembly balance adherens junction homeostasis

Soonjin Hong et al. Proc Natl Acad Sci U S A. .

Abstract

The homeostasis of adherens junctions was studied using E-cadherin and its two mutants tagged by the photoconvertible protein Dendra2 in epithelial A-431 cells and in CHO cells lacking endogenous cadherin. The first mutant contained point mutations of two elements, Lys738 and the dileucine motif that suppressed cadherin endocytosis. The second mutant contained, in addition, an extensive truncation that uncoupled the mutant from beta-catenin and p120. Surprisingly, the intact cadherin and its truncated mutant were recruited into the junctions with identical kinetics. The full-size cadherin was actively removed from the junctions by a process that was unaffected by the inactivation of its endocytic elements. The cadherin's apparent half-residence time in the junction was about 2 min. Cadherin clusters made of the truncated mutant exhibited much slower but ATP-independent junctional turnover. Taken together, our experiments showed that adherens junction homeostasis consists of three distinctive steps: cadherin spontaneous recruitment, its lateral catenin-dependent association, and its active release from the resulting clusters. The latter process, whose mechanism is not clear, may play an important role in various kinds of normal and abnormal morphogenesis.


Conflict of interest statement

The authors declare no conflict of interest.

Figures
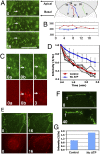
Fig. 1.
Fig. 1.
(A) Time-lapse images of cell–cell contact between two Ec-EGFP-expressing A-431 cells acquired at 2-min intervals (Left Column, only frames taken at 0, 8, and 16 min are shown, see Movie S1). The contact exhibits numerous apically moving adherens junctions, one of which is marked by an arrow. Schematic representation of this contact is shown at Right. Black arrows indicate the apical and basal regions of the contact. Trajectories of four adherens junctions are shown. The numbers indicate time intervals at which corresponding junctions can be traced in Movie S1. The red trajectory represents the arrow-marked junction. (Scale bar, 10 μm.) (B) Fluorescence intensities (in arbitrary units) of the junctions colored in A over time. Note that they fluctuate insignificantly. (C) Time-lapse analysis (selected frames from Movie S2) of adherens junctions between two A-431 cells expressing Ec-Dendra. At each time point, cells were imaged in green and red channels. The green channel shows normal Dendra2 fluorescence. The red channel reveals a photoconverted Dendra2 form. Frame 0a shows the cells before photoactivation. Note that the red fluorescence is undetectable. Frame 0b was taken immediately after the photoactivation. Frame 3 is 3 min later. (D) The graph shows changes in intensity of the red fluorescence in Ec-Dendra adherens junctions after Dendra2 activation. The black lines show values for four individual junctions, one of which is marked by an arrow in C. The red line is an average of four independent experiments (n = 30). The initial red fluorescence of the junctions is considered 1.0. The same experiment was also done with ATP-depleted cells (No ATP, blue line). The error bars represent SD (n = 20). (E) Redistribution of the cadherin molecules from the middle of the cells to the adherens junctions, frames from Movie S3: (0) immediately after the activation and (16) 16 min later. (F) Time-lapse images (Movie S5) of Ec-Dendra-expressing cell before (0) and 40 min after ATP depletion (40). The intensity of cadherin fluorescence in individual junctions (one of them is marked by an arrow) is increased. (G) The quantification of individual junction fluorescence (relative to the initial fluorescence, which is considered 1.0) before (control) and 20 min after the addition of ATP depletion media (no ATP). The average values of eight junctions from two independent experiments are shown.
Fig. 2.
Fig. 2.
(A) Schematic representation of E-cadherin and its mutants: the extracellular cadherin-like repeats (1–5), the transmembrane domain (TM), and the p120- and β-catenin-binding domains (p and cat, respectively) are shown. The solid square is the myc or the Dendra2 tags. The intracellular portion of the mutant Ec-Δ748 consists of a short, 17-amino-acid-long fragment that is located between the transmembrane and the p120-binding domains in the intact E-cadherin. Its amino acid sequence (lane Ec) is aligned with the homologous sequences of selected classic (N-cadherin, Nc) and type II (VE-cadherin, Vc; cadherin 11, C11) cadherins. Conserved residues are capitalized. Note that they all share two elements, a conserved Lys residue (K738) and, with the exception of VE-cadherin, a dileucine motif (LL motif). The line EcKL shows the KL mutation that is incorporated into the cadherin mutants Ec-KL-Dendra, Ec-Δ748-KL-Dendra, and Ec-Δ748-KL-Myc. (B) A-431 cells expressing Ec-Δ748-Myc (Δ748) and Ec-Δ748-KL-Myc (Δ748KL) mutants were surface biotinylated and then chased in regular media for 0, 15, or 30 min. The remaining surface biotin was stripped from the surface. Internalized biotinylated proteins were recovered using streptavidin-agarose and analyzed by immunoblotting using anti-myc. To approximate the size of the internalized cadherin pool, total biotinylated proteins from the control plates were precipitated by streptavidin-agarose and the same volumes of the resulting precipitates were loaded (T). Note that the KL mutation blocks the mutant internalization. (C) The same experiment as in B with A-431 cells expressing Ec-Dendra and Ec-KL-Dendra proteins. The blots were stained with anti-cadherin antibody recognizing both the endogenous (Ec) and the recombinant (Ec-D or Ec-KLD) cadherins. The control lane T was loaded with 25% of the precipitate. Note that whereas endogenous cadherin endocytosed identically in both cell clones, the Ec-KL-Dendra mutant had a much lower rate of endocytosis. (D and D′) Double immunofluorescence microscopy of Ec-Δ748-Myc-expressing A-431 cells. The cells were stained with rabbit anti-myc (D, myc) and mouse anti-β-catenin (D′, βCat) antibodies. Only negligible amounts of the mutant were present in the β-catenin-positive adherens junctions. (E and E′) The same experiment as in D with Ec-Δ748-KL-Myc-expressing cells shows the efficient recruitment of the mutant into the endogenous adherens junctions. (FH) Anti-Dendra staining of A-431 cells expressing Ec-Dendra (F); a low level of Ec-KL-Dendra (G) and a high level of Ec-KL-Dendra, clone EcKLD2 (H).
Fig. 3.
Fig. 3.
(A) The equal amounts of cell lysates of WT A-431 cells (A431), and A-431 cell subclones expressing Ec-Dendra (EcD) or Ec-KL-Dendra (EcKLD) were stained for E-cadherin. Arrows indicate endogenous cadherin (Ec) and the recombinant Dendra-tagged cadherins (EcD). Note that the levels of the recombinant cadherins are the same. (B) Total lysates of cells expressing a low level of Ec-KL-Dendra (EcKLD, the subclone is the same as in A), high level of the same protein (EcKLD2) and Ec-Δ748-KL-Dendra (Δ748) were analyzed using anti-Dendra2 (Dn), anti-E-cadherin (Ec), and anti-tubulin (Tl) antibodies. (C) Time-lapse (selected frames from Movie S6) of adherens junctions between two Ec-Δ748-KL-Dendra expressing cells. Frame 0 shows the cells immediately after photoactivation. Frame 3 is 3 min later. (D) Time-lapse images (Movie S7) acquired at 20-sec intervals of the Ec-Δ748-KL-Dendra mutant clustering during the calcium-shift assay (numbers indicate seconds after addition of calcium). Frame 0 shows cells immediately before addition of calcium. Note that the cadherin mutant forms clusters nearly instantly. (E) The average decay of red fluorescence in adherens junctions of cells expressing different Ec-Dendra mutants in A-431 cells. The error bars represent SD (n = 20). (F) Clustering kinetics of Ec-Δ748-KL-Dendra (EcΔ748KLD) and Ec-KL-Dendra (EcKLD) mutants after addition of calcium (n = 10).
Fig. 4.
Fig. 4.
(A and B) CHO cell subclones stably expressing Ec-KL-Dendra (A) and Ec-Δ748-KL-Dendra (B) mutants and stained using anti-Dendra antibody. (C) Turnover of cadherin and its mutant in CHO cells. Black lines show the average decay of the adherens junction red fluorescence in control (filled circles) and ATP-depleted (filled squares) CHO cells expressing Ec-KL-Dendra (EcKLD). The error bars represent SD. (n = 20). Blue (control cells) and red (ATP-depleted cells) lines show the decrease of red fluorescence in individual junctions of the Ec-Δ748-KL-Dendra expressing cells. Note the big difference in the rates of decay between individual junctions in control cells, but the relatively uniform rates for ATP-depleted cells. (D) Total lysates of CHO subclones expressing Ec-KL-Dendra (EcKLD) and Ec-Δ748-KL-Dendra (Δ748) were analyzed using anti-Dendra2 (Dn) and anti-tubulin (Tl) antibodies.

Similar articles

Cited by

References

    1. Yap AS, Brieher WM, Gumbiner BM. Molecular and functional analysis of cadherin-based adherens junctions. Annu Rev Cell Dev Biol. 1997;13:119–146. - PubMed
    1. Takeichi M. Morphogenetic roles of classic cadherins. Curr Opin Cell Biol. 1995;7:619–627. - PubMed
    1. Shapiro L, Weis WI. Structure and biochemistry of cadherins and catenins. Cold Spring Harb Perspect Biol. 2009;1:a003053. - PMC - PubMed
    1. Troyanovsky S. Cadherin dimers in cell-cell adhesion. Eur J Cell Biol. 2005;84:225–233. - PubMed
    1. Provost E, Rimm DL. Controversies at the cytoplasmic face of the cadherin-based adhesion complex. Curr Opin Cell Biol. 1999;11:567–572. - PubMed

Publication types