. 2010 Feb 23;107(8):3746-51.
doi: 10.1073/pnas.1000041107. Epub 2010 Feb 2.

Dynamics of intracellular bacterial replication at the single cell level

Affiliations

Dynamics of intracellular bacterial replication at the single cell level

Sophie Helaine et al. Proc Natl Acad Sci U S A. .

Abstract

Several important pathogens cause disease by surviving and replicating within host cells. Bacterial proliferation is the product of both replication and killing undergone by the population. However, these processes are difficult to distinguish, and are usually assessed together by determination of net bacterial load. In addition, measurement of net load does not reveal heterogeneity within pathogen populations. This is particularly important in persistent infections in which slow or nongrowing bacteria are thought to have a major impact. Here we report the development of a reporter system based on fluorescence dilution that enables direct quantification of the replication dynamics of Salmonella enterica serovar Typhimurium (S. Typhimurium) in murine macrophages at both the population and single-cell level. We used this technique to demonstrate that a major S. Typhimurium virulence determinant, the Salmonella pathogenicity island 2 type III secretion system, is required for bacterial replication but does not have a major influence on resistance to killing. Furthermore, we found that, upon entry into macrophages, many bacteria do not replicate, but appear to enter a dormant-like state. These could represent an important reservoir of persistent bacteria. The approach could be extended to other pathogens to study the contribution of virulence and host resistance factors to replication and killing, and to identify and characterize nonreplicating bacteria associated with chronic or latent infections.


Conflict of interest statement

The authors declare no conflict of interest.

Figures

Fig. 1.
Fig. 1.
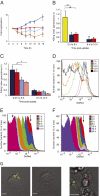
FD enables measurement of bacterial replication for up to 10 generations. (A) Structure of pDiGc and pDiGi plasmids and schematic of FD principle. With pDiGc, bacterial replication is accompanied by dilution of red fluorescence in the absence of arabinose and detection of bacteria is based on EGFP signal. With pDiGi, sequential removal of arabinose and IPTG leads to dilution of red then green fluorescence. (B and C) Flow cytometric detection of DsRed (B) or EGFP (C) fluorescence in the bacterial population (carrying pDiGi) grown in minimum liquid medium (from an OD600 of 0.05) at hourly intervals (n = 30,000 events analyzed at each time point). (D) Bacterial replication curves determined by cfu and FD analysis from one representative experiment of three. Angled arrows indicate removal of arabinose at to and IPTG at t4h. Black diamonds show cfu, red triangles red FD, and green squares green FD. The extent of replication of the population (F, fold replication) was calculated by the ratio: Yo/Yt (Y being the geometric mean of red or green fluorescence intensity of the bacterial population at a specific time). The number of generations, N, is deduced from F = 2N.
Fig. 2.
Fig. 2.
Quantification and analysis of heterogeneity of S. Typhimurium replication in macrophages with pDiGc. (A) Quantification of replication and net growth in bm macrophages. Replication kinetics of WT (dark blue, open circles) and SPI-2 mutant (red, open squares) determined by FD and net growth kinetics of WT (light blue, filled circles) and SPI-2 mutant (orange, filled squares) determined by cfu. (B and C) Killing indices of WT (dark blue) and SPI-2 mutant (red) compared with a sensitive rpoE mutant (yellow) (25) in BALB/c bm macrophages (B) and of WT and SPI-2 mutant bacteria in C57BL/6 WT bm macrophages (dark blue and dark red, respectively) or phox−/− macrophages (pale blue and pale red, respectively) (C). *P < 0.05, **P < 0.01 on paired, one-tailed Student t test. Error bars (SEM) are based on three replicate experiments. (D–F) Flow cytometric detection of DsRed fluorescence in the intracellular population at different time points (n = 50,000 events analyzed at each time point). WT bacteria released from bm macrophages (D) and WT (E) and SPI-2 mutant (F) bacteria released from RAW264.7 macrophages. Vertical arrows indicate nonreplicating subpopulation. Angled arrows indicate 12 h time point for WT (E) and 24 h time point for SPI-2 mutant bacteria (F). (G) Microscopy of infected macrophages. Left: bm macrophages infected for 24 h; one macrophage contains both replicating and nonreplicating bacteria and another contains one nonreplicating bacterium. Right: splenic macrophages isolated from BALB/c mice infected for 3 d; replicating and nonreplicating bacteria are present in different macrophages. (Scale bars: 10 μm.)
Fig. 3.
Fig. 3.
Viability of nonreplicating WT S. Typhimurium. (A) Schematic of the detection of viability of nonreplicating bacteria using the pDiGi system. (BD) Time-lapse microscopy of infected RAW264.7 macrophages. Numbers above the fields are hours and minutes after addition of arabinose. (B) Replicating bacteria revealed by appearance of red fluorescence. (C) Nonreplicating bacterium failing to respond to induction. (D) Nonreplicating bacterium responding to arabinose by producing DsRed. (E and F) Flow cytometric detection of DsRed fluorescence in nonreplicating bacteria with (red) or without (blue) 4 h arabinose induction; (E) bm macrophages infected for 20 h (n = 800 nonreplicating bacteria); (F) splenic macrophages isolated from 4 129SV mice infected for 2 d (n = 100 nonreplicating bacteria).
Fig. 4.
Fig. 4.
(A) Responsiveness after exposure to different conditions. Proportion of responsive nonreplicating bacteria in bm macrophages (black bars), in PBS solution after release from macrophages at 24 h (white bars), in phox−/− macrophages (gray bars), and in IFN-γ–activated macrophages (horizontal lined bars; n > 50,000 bacteria). (B) Proportion of nonreplicating bacteria colocalizing with cathepsin D (CtsD) in bm macrophages (black bars) compared with heat-killed bacteria (gray bars; n = 150–300 macrophages). Error bars (SEM) are based on three replicate experiments.

Similar articles

Cited by

References

    1. Fields PI, Swanson RV, Haidaris CG, Heffron F. Mutants of Salmonella typhimurium that cannot survive within the macrophage are avirulent. Proc Natl Acad Sci USA. 1986;83:5189–5193. - PMC - PubMed
    1. Monack DM, Bouley DM, Falkow S. Salmonella typhimurium persists within macrophages in the mesenteric lymph nodes of chronically infected Nramp1+/+ mice and can be reactivated by IFNgamma neutralization. J Exp Med. 2004;199:231–241. - PMC - PubMed
    1. Haraga A, Ohlson MB, Miller SI. Salmonellae interplay with host cells. Nat Rev Microbiol. 2008;6:53–66. - PubMed
    1. Hensel M, et al. Simultaneous identification of bacterial virulence genes by negative selection. Science. 1995;269:400–403. - PubMed
    1. Shea JE, Beuzon CR, Gleeson C, Mundy R, Holden DW. Influence of the Salmonella typhimurium pathogenicity island 2 type III secretion system on bacterial growth in the mouse. Infect Immun. 1999;67:213–219. - PMC - PubMed

Publication types