. 2010 Feb 16;107(7):2944-9.
doi: 10.1073/pnas.0912090107. Epub 2010 Feb 1.

Determining the distribution of probes between different subcellular locations through automated unmixing of subcellular patterns

Affiliations

Determining the distribution of probes between different subcellular locations through automated unmixing of subcellular patterns

Tao Peng et al. Proc Natl Acad Sci U S A. .

Abstract

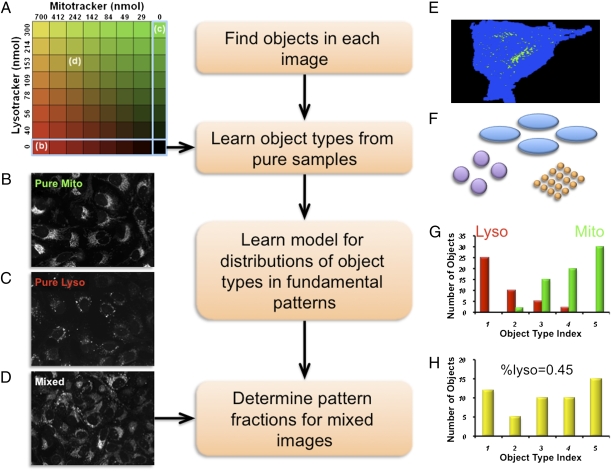
Many proteins or other biological macromolecules are localized to more than one subcellular structure. The fraction of a protein in different cellular compartments is often measured by colocalization with organelle-specific fluorescent markers, requiring availability of fluorescent probes for each compartment and acquisition of images for each in conjunction with the macromolecule of interest. Alternatively, tailored algorithms allow finding particular regions in images and quantifying the amount of fluorescence they contain. Unfortunately, this approach requires extensive hand-tuning of algorithms and is often cell type-dependent. Here we describe a machine-learning approach for estimating the amount of fluorescent signal in different subcellular compartments without hand tuning, requiring only the acquisition of separate training images of markers for each compartment. In testing on images of cells stained with mixtures of probes for different organelles, we achieved a 93% correlation between estimated and expected amounts of probes in each compartment. We also demonstrated that the method can be used to quantify drug-dependent protein translocations. The method enables automated and unbiased determination of the distributions of protein across cellular compartments, and will significantly improve imaging-based high-throughput assays and facilitate proteome-scale localization efforts.


Conflict of interest statement

The authors declare no conflict of interest.

Figures

Fig. 1.
Fig. 1.
Subcellular pattern unmixing approach. (A) The starting point is a collection of images (typically from a multiwell plate) in which various concentrations of two probes are present (the concentrations of the Mitotracker and Lysotracker probes are shown by increasing intensity of red and green, respectively). Example images are shown for wells containing just Mitotracker (B), just Lysotracker (C), or a mixture of the two probes (D). The steps in the analysis process are shown: finding objects (E), learning object types (illustrated schematically as objects with different sizes and shapes) (F), learning the object type distributions for the two fundamental patterns (G), and unmixing a mixed object type distribution (H).
Fig. 2.
Fig. 2.
Distribution of object types within fundamental patterns. The average number of objects of each type is shown for the combination of all images of U2OS cells stained with either Mitotracker (black) or Lysotracker (white). The object types are sorted according to the difference between the numbers of objects in the two patterns. Thus, the lowest numbered object types are primarily found in Mitotracker-stained cells, while the highest numbered object types are primarily found in Lysotracker-stained cells. The model power is 0.448 when trained with object frequency distributions and 0.654 when trained with fluorescence fraction distributions.
Fig. 3.
Fig. 3.
Expected and estimated pattern fraction for three unmixing methods for the U2OS dataset. The balance between lysosomal and mitochondrial pattern (either expected or estimated) is represented as the fraction of the total pattern (black, 100% mitochondrial; white, 100% lysosomal). For the expected fraction, this is estimated as linearly proportional to the ratio of the relative concentration of the mitochondrial probe to the sum of the relative concentration of the lysosomal and mitochondrial probes (where relative concentration is defined as fraction of the maximum subsaturating concentration).
Fig. 4.
Fig. 4.
Effectiveness of outlier removal methods. (A) Nuclear images were used as outliers. Unmixing accuracies for both inliers (squares, mitochondrial and lysosomal objects) and outlier objects (triangles) with first-level outlier exclusion were approximated by cross validation under different chosen accuracy levels for the U2OS dataset. Nuclear fluorescence was totally removed at all accuracy levels. (B) ER pattern images were used as outliers. Average outlier recognition testing-accuracies for both inliers (squares, mitochondrial and lysosomal images) and outlier images (triangles) with second-level outlier exclusion were approximated by cross validation under different chosen accuracy levels for the BEAS2B dataset. The best separation is obtained using a 75–80% inlier confidence level.
Fig. 5.
Fig. 5.
Application of pattern unmixing to drug effects. Cells were treated with various concentrations of Bafilomycin a1 (BAF) and images from samples receiving the highest dose and images from untreated cells were used to train an unmixing model. The fraction of drug treated pattern as a function of concentration of drug was estimated using linear unmixing (squares), multinomial unmixing (circles), and fluorescence fraction unmixing (triangles). eGFP-LC3 showed a gradual relocation between the two patterns as a function of BAF concentration.

References

    1. Davis JR, Kakar M, Lim CS. Controlling protein compartmentalization to overcome disease. Pharm Res. 2007;24:17–27. - PubMed
    1. Kaffman A, O’Shea EK. Regulation of nuclear localization: a key to a door. Annu Rev Cell Dev Biol. 1999;15:291–339. - PubMed
    1. Schüller C, Ruis H. Regulated nuclear transport. Results Probl Cell Differ. 2002;35:169–189. - PubMed
    1. Kau TR, Way JC, Silver PA. Nuclear transport and cancer: from mechanism to intervention. Nat Rev Cancer. 2004;4:106–117. - PubMed
    1. Costes SV, et al. Automatic and quantitative measurement of protein-protein colocalization in live cells. Biophys J. 2004;86:3993–4003. - PMC - PubMed

Publication types

MeSH terms

Substances

LinkOut - more resources